Performing SPSS Analysis with AI
Discover how Vizly transforms traditional SPSS workflows into automated analysis that can be completed by simply asking a question.
Getting Started with Vizly for SPSS
SPSS (Statistical Package for the Social Sciences) is a tool widely employed for statistical analysis in various fields, particularly in social science research. Its strengths lie in its capacity to handle vast datasets and generate meaningful visualizations, making it extremely valuable for informed decision-making across academia, market research, and industry sectors.
Despite its capabilities, SPSS has a steep learning curve to master. Luckily, Vizly helps in addressing these challenges. Utilizing artificial intelligence, Vizly simplifies SPSS data analysis, making it simple for anyone to upload their .sav file and generate analysis just by asking questions.
To start, you can begin by uploading your sav file; for more detailed instructions on how to upload your data, visit our Getting Started guide. For the purposes of this example, we will use a dataset of album tracks. We will use Vizly to discover the features of the dataset along with their relationships.
Exploring your data
Once the data is loaded, Vizly automatically offers insightful suggestions to help you quickly identify different paths of analysis you can take. For instance, you can click on "Top selling albums by genre" to instantly generate an analysis ranking the top selling albums in the data.
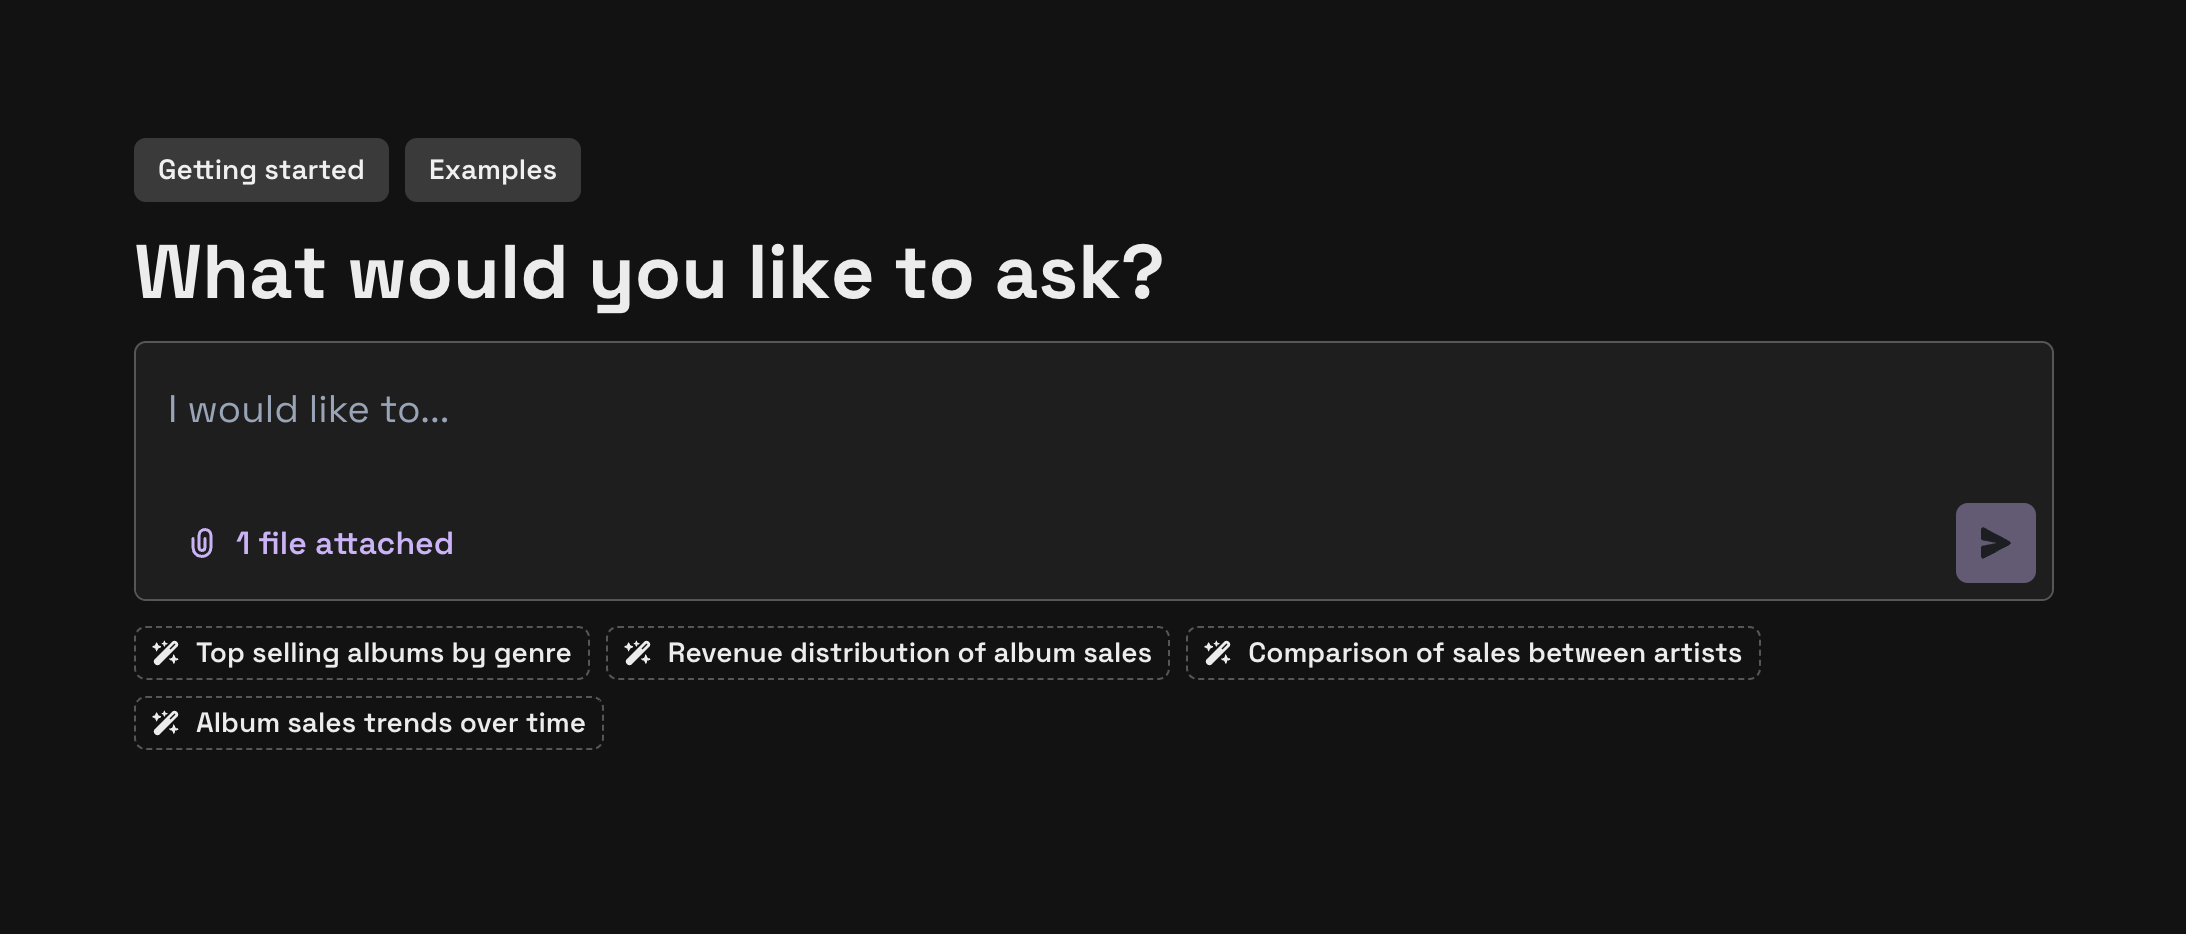
Automated suggestions like 'Top selling albums by genre' streamline the identification of key questions to ask.
Since we do not have a great view of the data, as a first step, let's get a better look at the data by asking Vizly to give an overview of the data, as well as a more detailed description of each column.
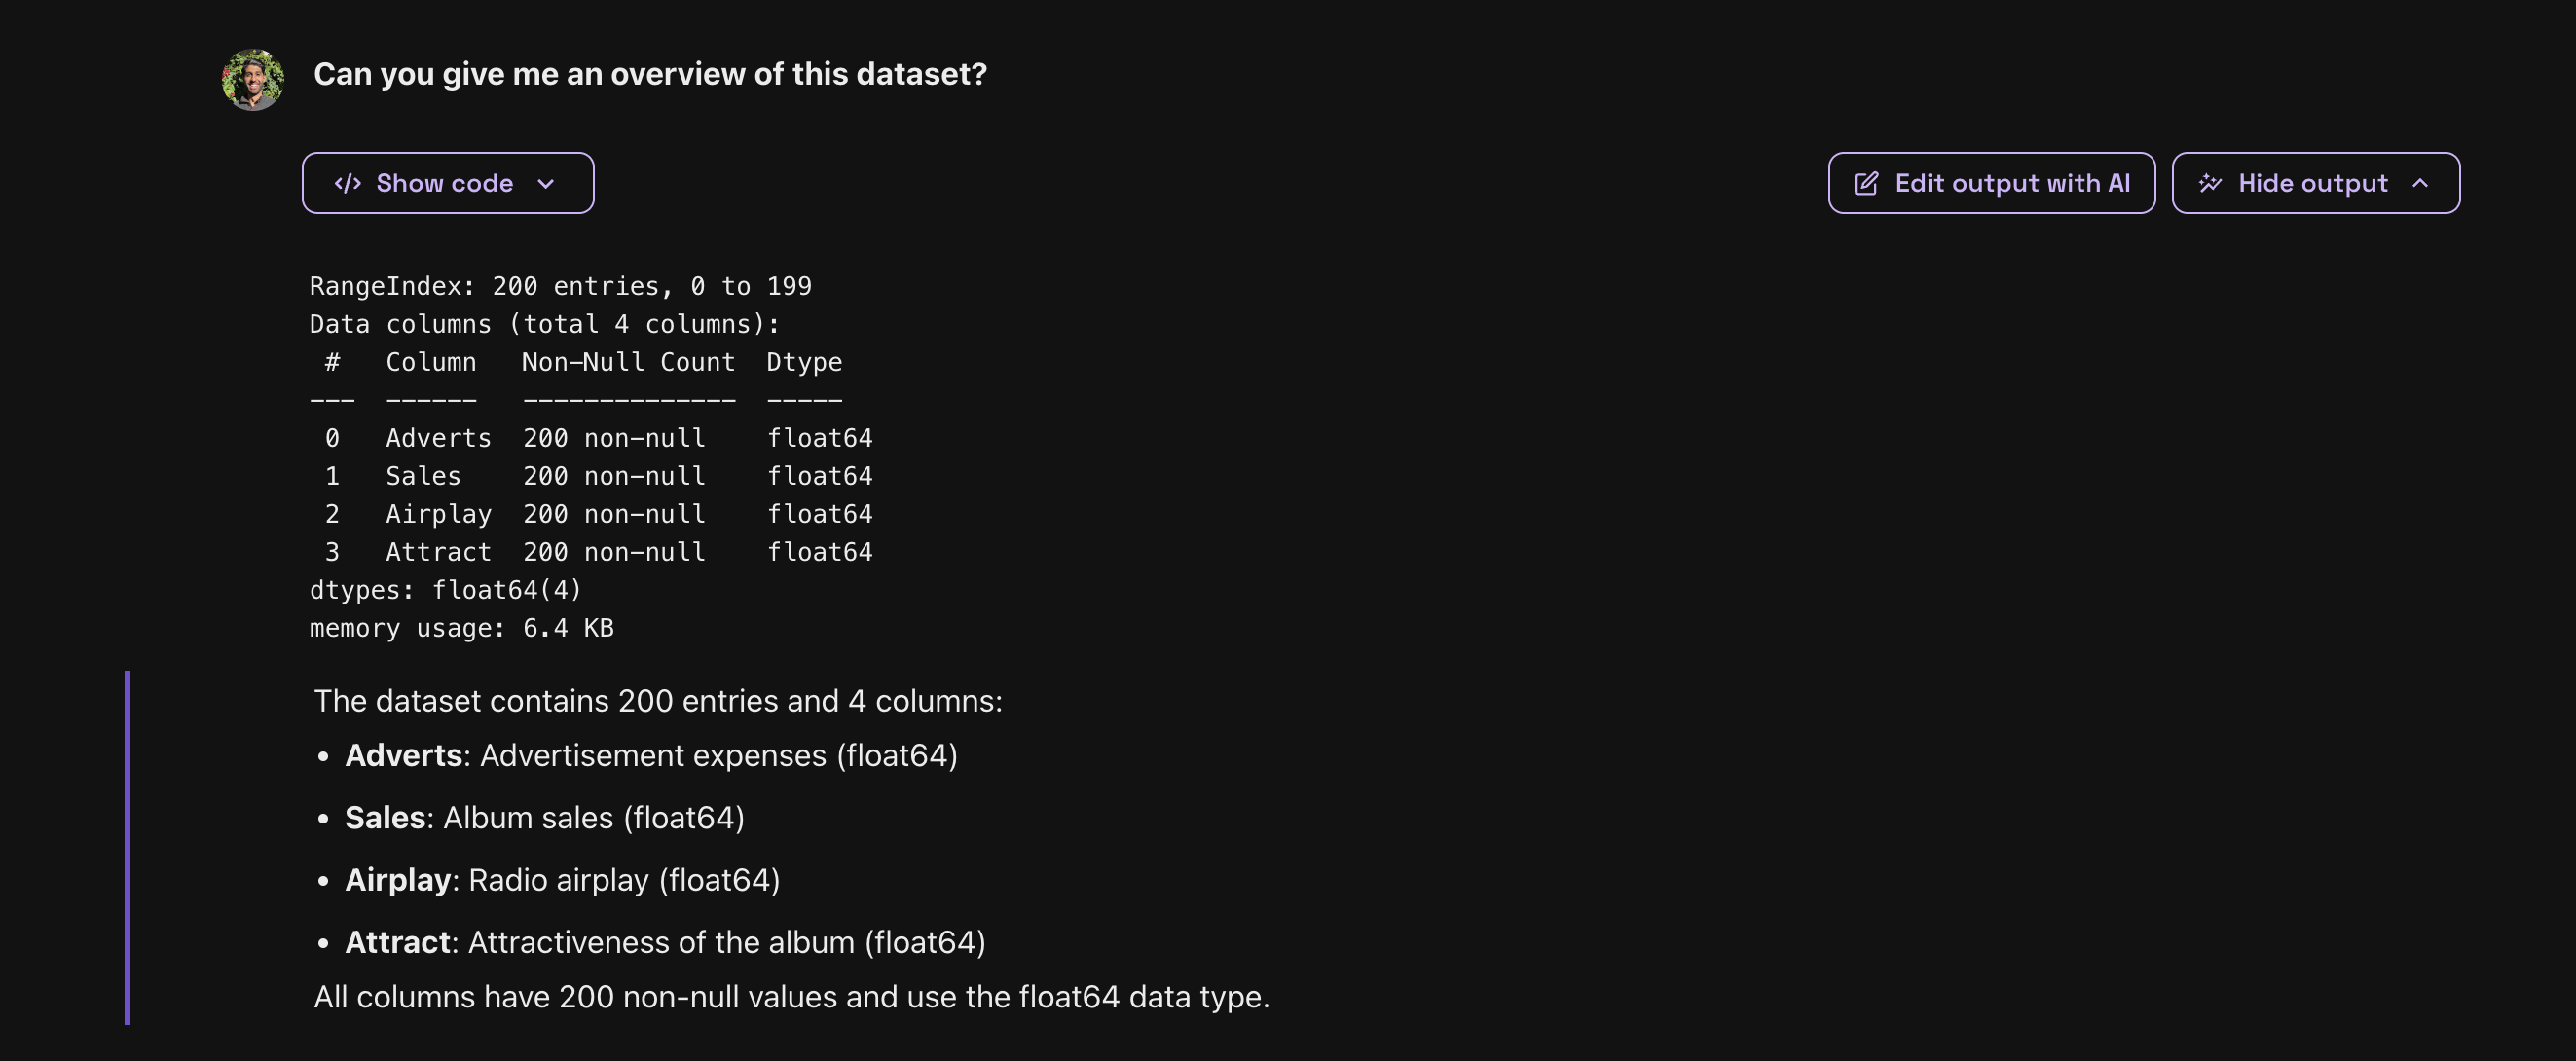
Vizly can give you an overview of your data to help you make the best decisions about your data analysis.
Our data seems to have four columns, relating to advertising expenses, sales, radio play and overall attractiveness of the album.
Visualizing your data
Once the data is loaded, it is easy to start visualizing your data. To do so, you can click on the "Visualize this for me" button or you can ask for a specific type of visualization you would like to see. In the example below, we ask for a visualization of the distribution of our data.
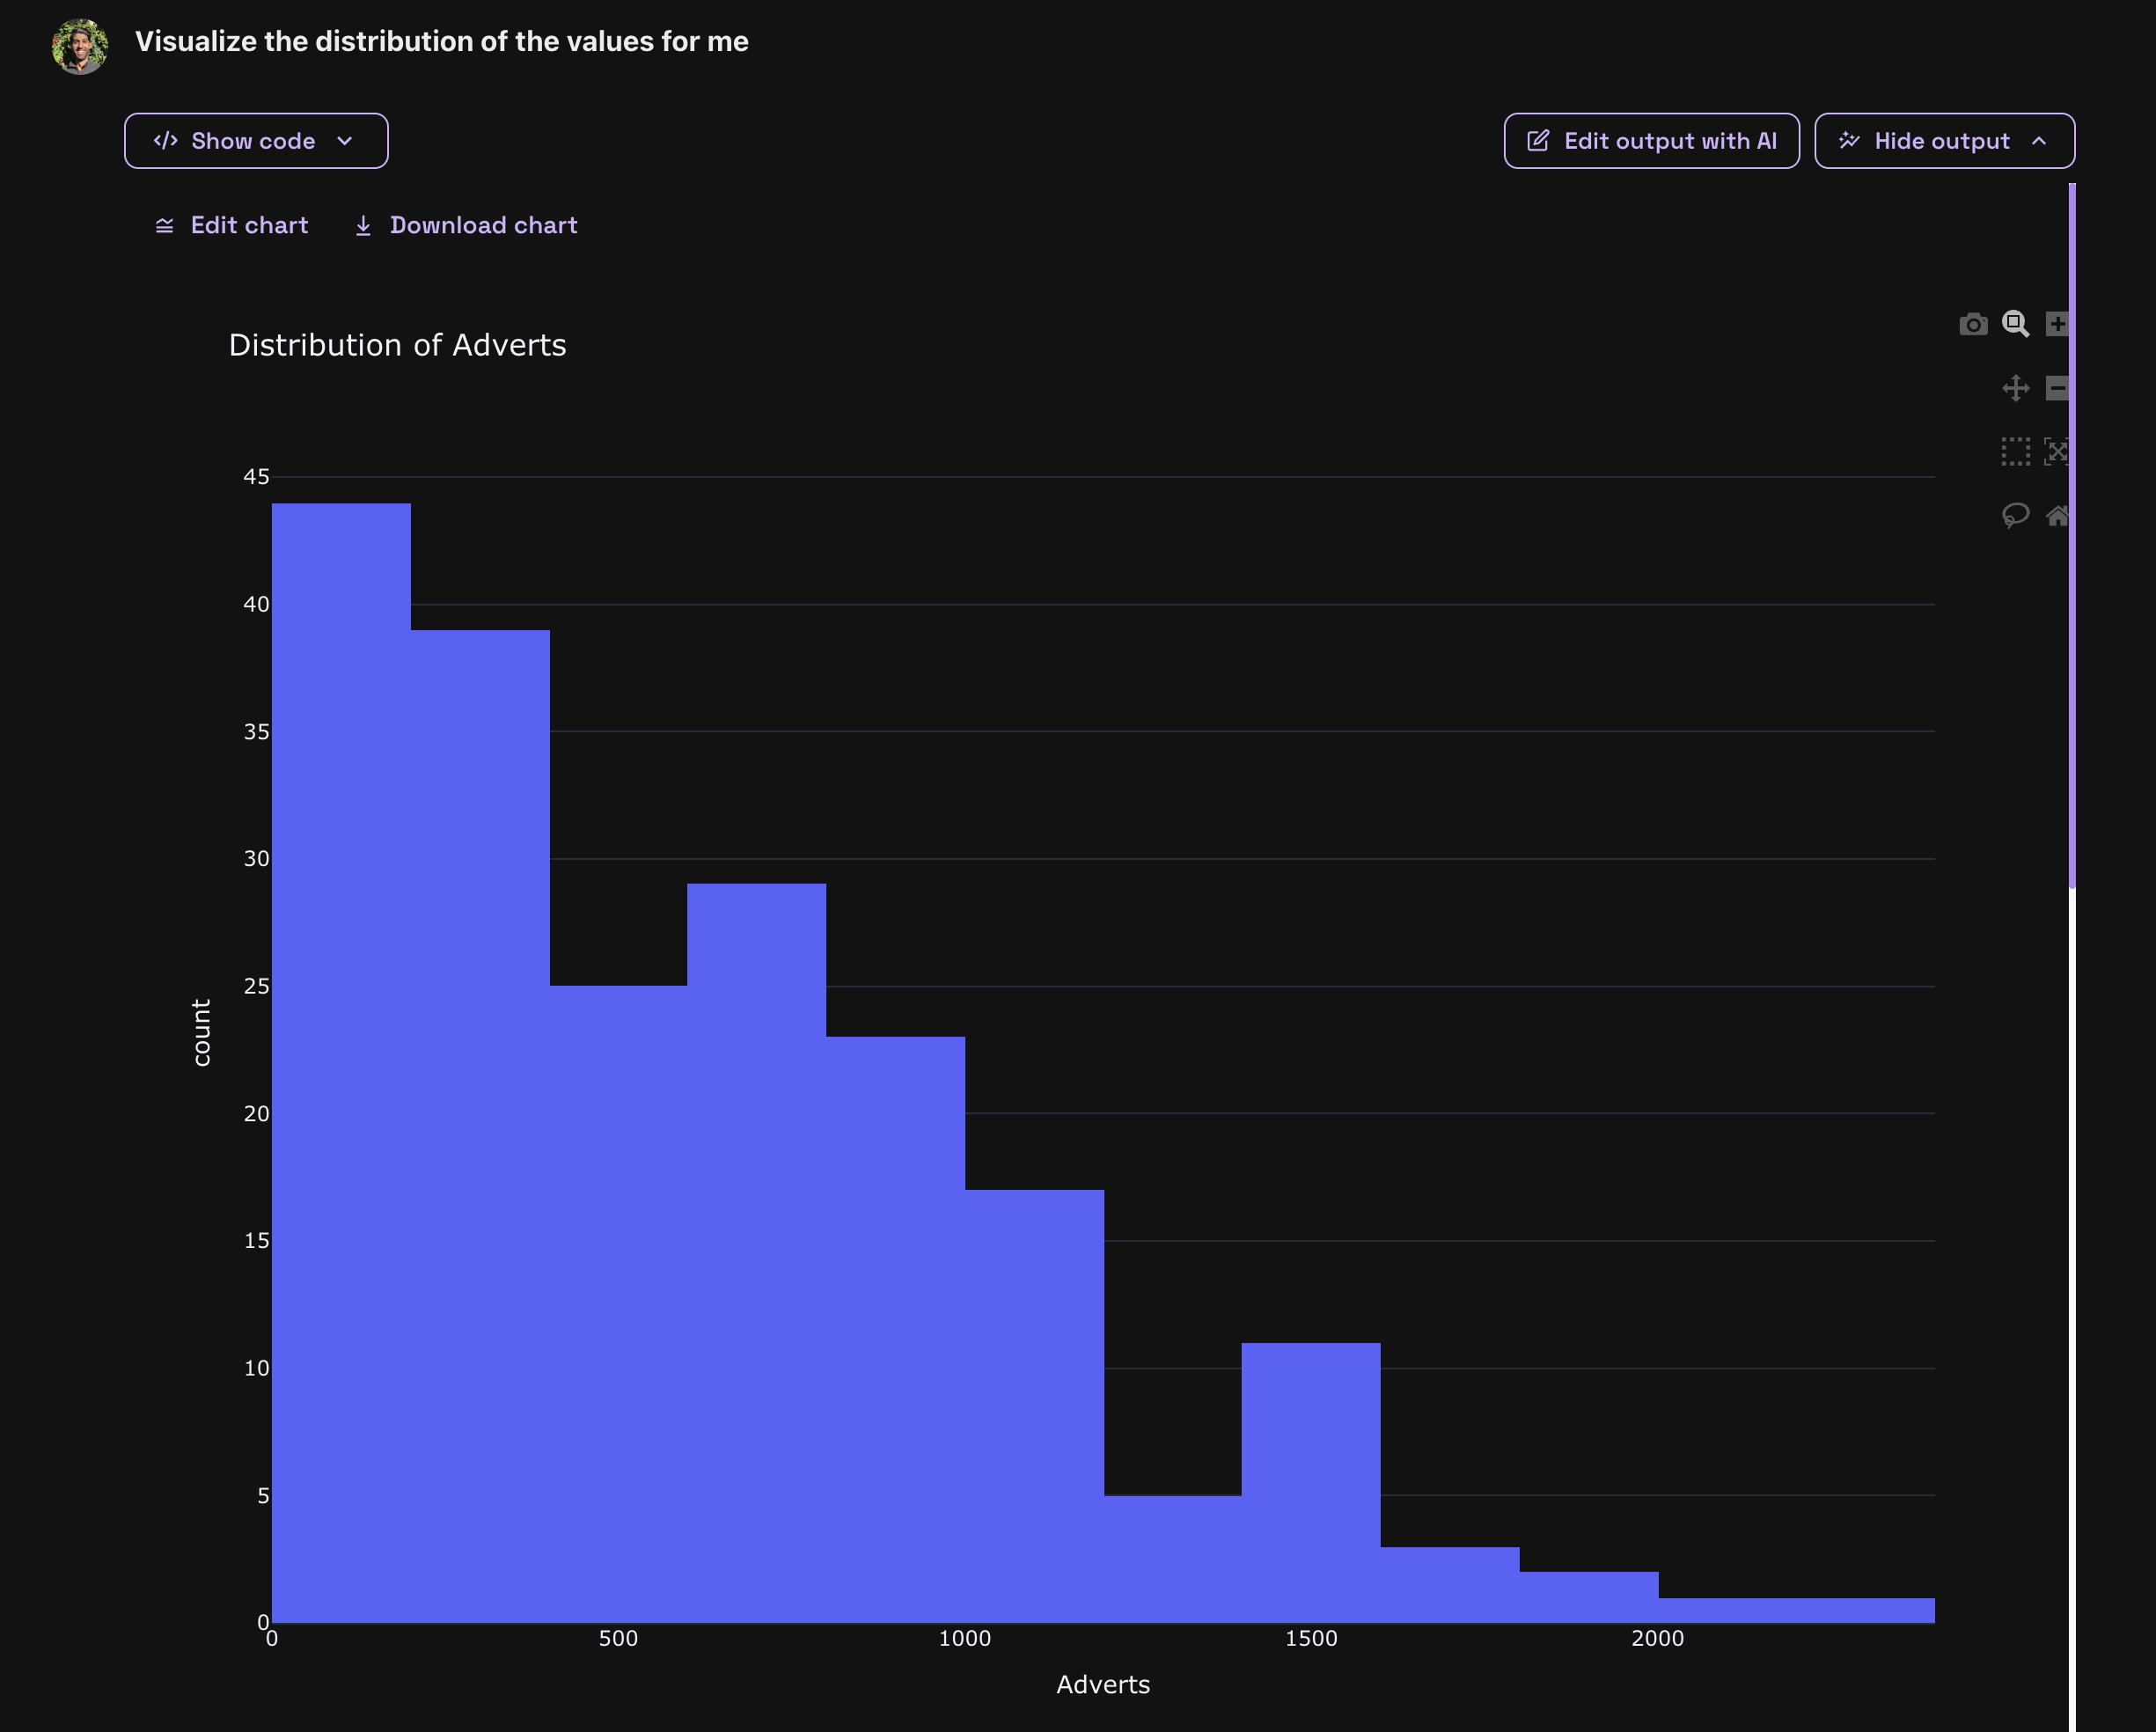
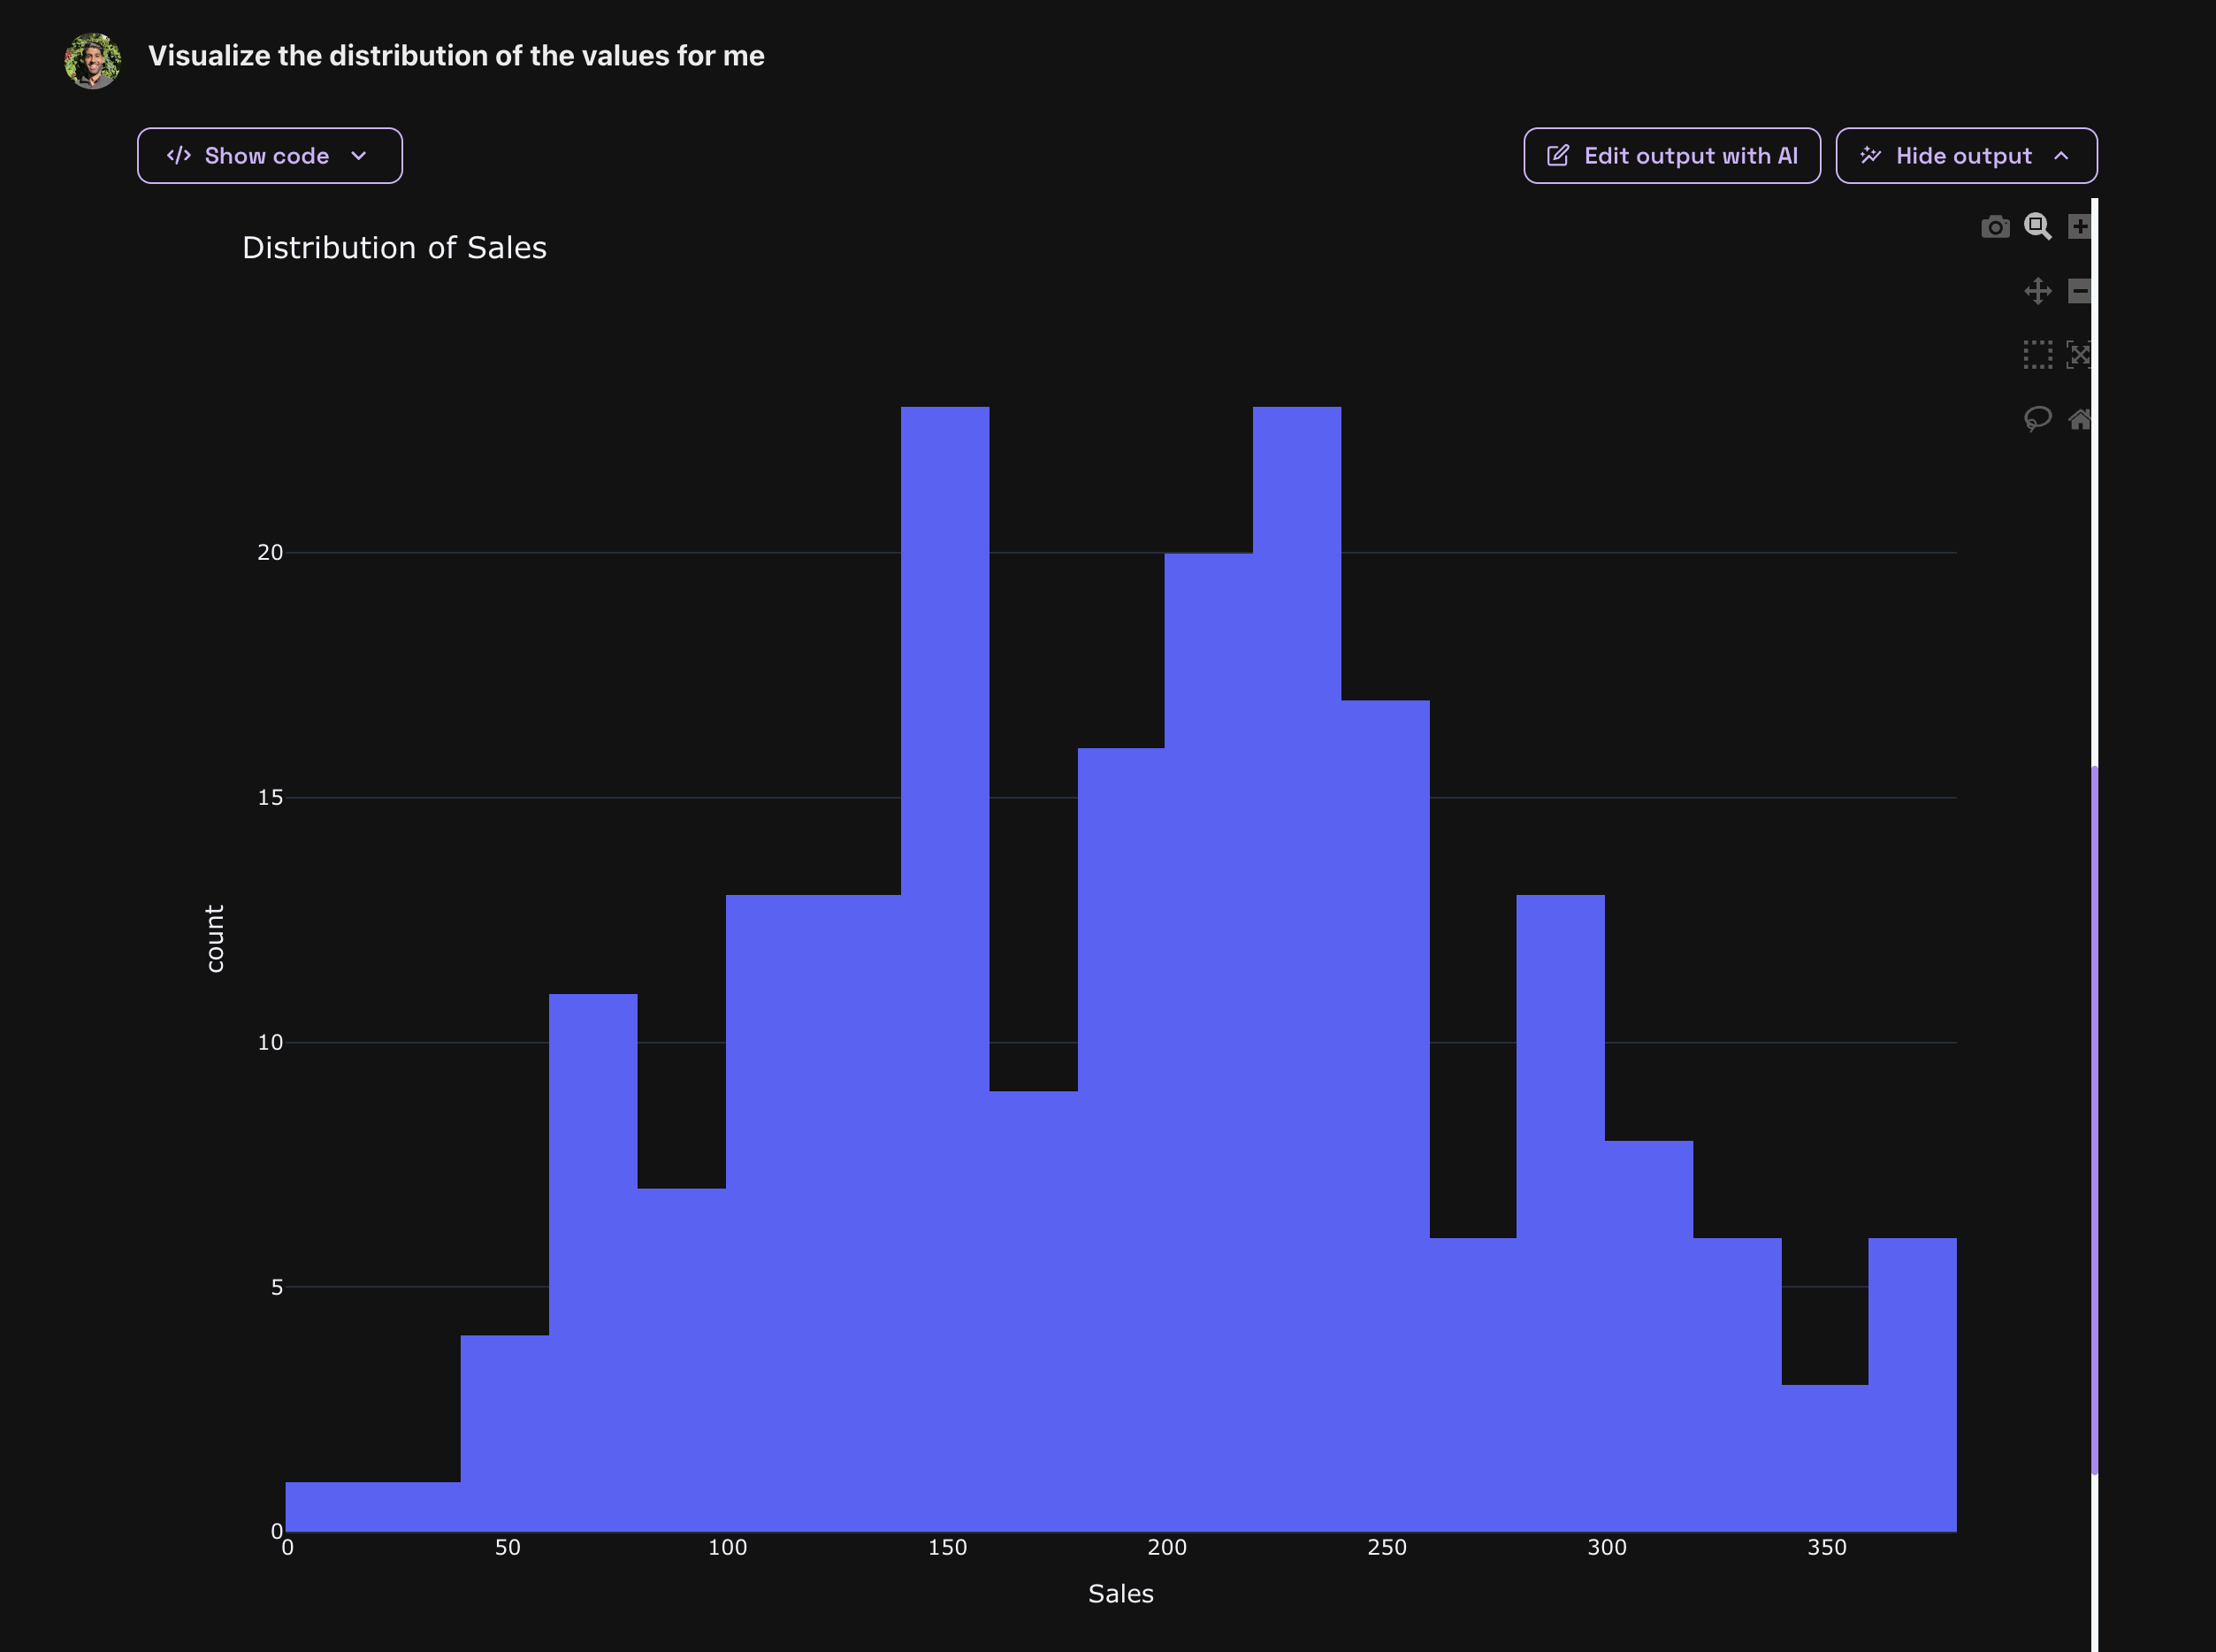
Vizly makes visualizations simple and easy to do.
Just by asking for a data distribution, we were able to use Vizly to immediately generate visuals of our data distributions. There was no need to navigate complicated menus, understand which buttons to press or which paths we could take. All of it was done automatically for us.
Calculating Statistics
With Vizly, it is also simple to calculate statistics about the data. As an example, we will calculate a t-test and p-values for our data. However, you can imagine that we can perform any sort of analysis with this data as well.
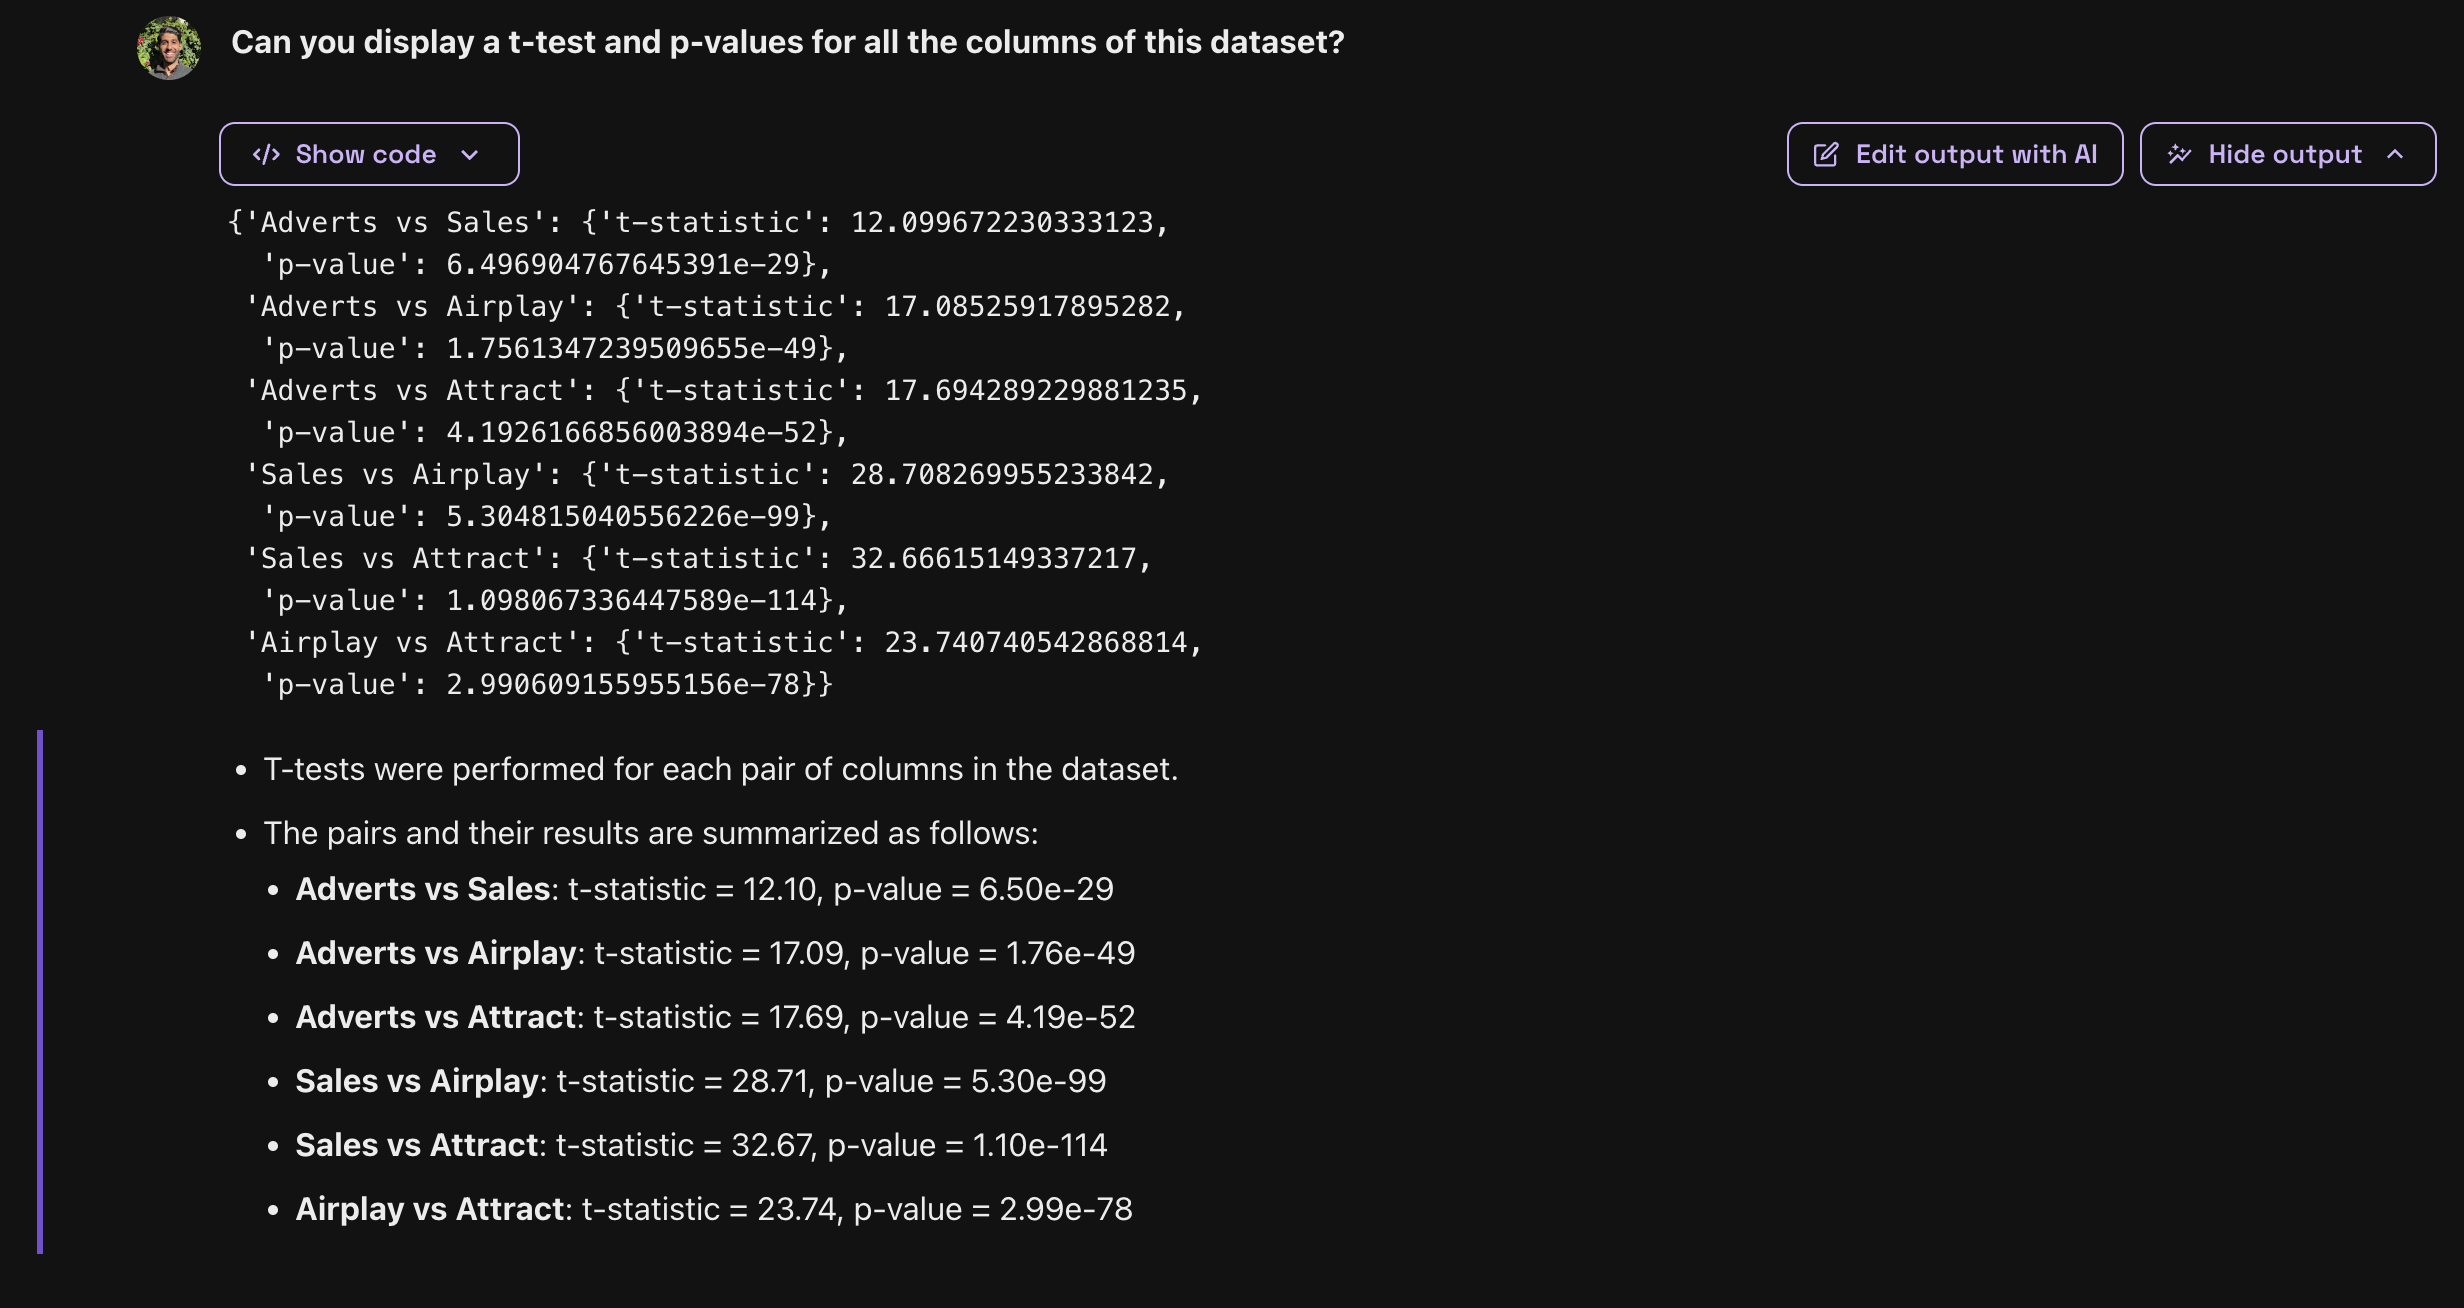
Calculating P-test and T-test is simple and easy to do using Vizly's AI capabilities
In our dataset, we notice that the p-values are very small indicating that there is a significant difference in the means of the two groups.
Conclusion
Vizly's extensive AI capabilities have helped numerous students and professionals in their analytical work, establishing it as a reliable tool when used in place of tools like SPSS. Vizly streamlines the complex data analysis process, enabling users to concentrate more on deriving insights rather than dealing with technical complexities.
Try Vizly now