Analyzing Google Sheets with AI
Discover how Vizly enhances your Google Sheets experience by providing AI-driven insights and visualizations at the click of a button.
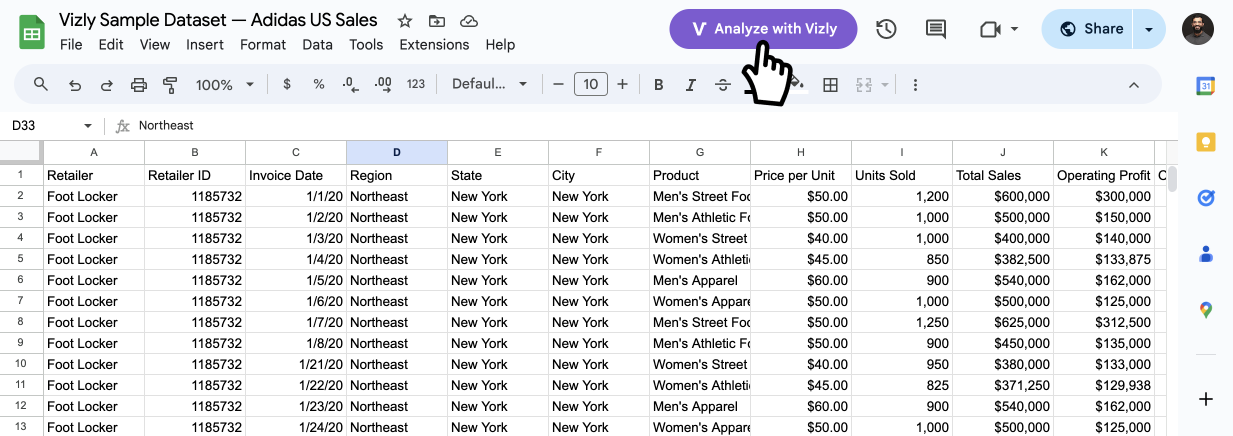
Introduction to Vizly for Google Sheets
Google Sheets is an incredibly versatile tool for managing and analyzing data. Whether you're tracking sales, monitoring budgets, or planning projects, Google Sheets offers a wide range of functionalities that make data management straightforward and efficient.
With the integration of Vizly, analyzing and visualizing your Google Sheets data has never been easier. By simply clicking the "Analyze with Vizly" button, you can unlock powerful AI-driven insights and visualizations without needing advanced data analysis skills.
To get started, install the Vizly Chrome extension from the Chrome Web Store. Once installed, open any Google Sheet and click the "Analyze with Vizly" button to begin your data analysis journey.
Instant Insights at Your Fingertips
Once you click the "Analyze with Vizly" button, Vizly immediately offers insightful suggestions to help you identify key areas of analysis. Whether you're looking to understand sales trends, track project progress, or analyze survey results, Vizly provides automated insights tailored to your data.
Simply click 'Analyze with Vizly'.
For example, Vizly will automatically offer suggestions to show you the top-selling products or visualize sales trends over time. These suggestions help you quickly gain a deeper understanding of your data without the need for manual analysis.

Automated suggestions streamline the identification of key questions to ask.
Effortless Data Visualization
Vizly makes it incredibly easy to visualize your data. Simply ask Vizly for specific types of visualizations, such as bar charts, pie charts, or line graphs, and watch as your data is transformed into clear, insightful visuals.
With Vizly, you don't need to navigate complicated menus or perform manual steps to create visualizations. Everything is done automatically, saving you time and effort.
Advanced Statistical Analysis Made Simple
Vizly also offers advanced statistical analysis capabilities. Whether you need to perform a regression analysis, calculate summary statistics, or conduct hypothesis testing, Vizly makes these tasks simple and accessible.
By leveraging Vizly's AI-driven analysis, you can uncover meaningful insights from your data, helping you make informed decisions and drive better outcomes.
Conclusion
Vizly's integration with Google Sheets transforms how you interact with your data. By automating complex tasks and providing intuitive suggestions, Vizly empowers you to focus on deriving actionable insights rather than dealing with technical complexities.
Try Vizly now