Leveraging AI for Sociology Research
Discover how Vizly enhances sociology research by providing AI-driven insights and visualizations, making complex data analysis accessible and efficient.
Introduction to Vizly for Sociology Research
Sociological research involves understanding human behavior, social interactions, and cultural phenomena. Researchers often use large datasets to analyze trends and patterns in society, making it essential to have powerful tools for data analysis and visualization.
Vizly provides sociologists with robust AI-driven tools to analyze and visualize complex social data. By integrating Vizly into your research workflow, you can uncover meaningful insights and make data-driven conclusions that advance the field of sociology. Vizly supports various data formats including Excel, SPSS, and others, allowing for seamless integration into your existing workflows. Additionally, Vizly offers the ability to run R scripts directly within the platform, eliminating the need for separate tools like R Studio.
To get started with Vizly, sign up and enhance your sociological research projects with Vizly.
Dataset Overview
The General Social Survey (GSS) collects data on contemporary American society to monitor and explain trends in attitudes, behaviors, and attributes. The provided dataset includes variables related to the year of the survey, respondent ID, and the ballot used for the interview. For more details, you can access the dataset from GSS Data Explorer.
Analyzing Ballot Usage Over the Years
One way to utilize this dataset is by analyzing the usage of different ballots over the years. Understanding which ballots were used more frequently can provide insights into survey methodologies and their evolution over time.
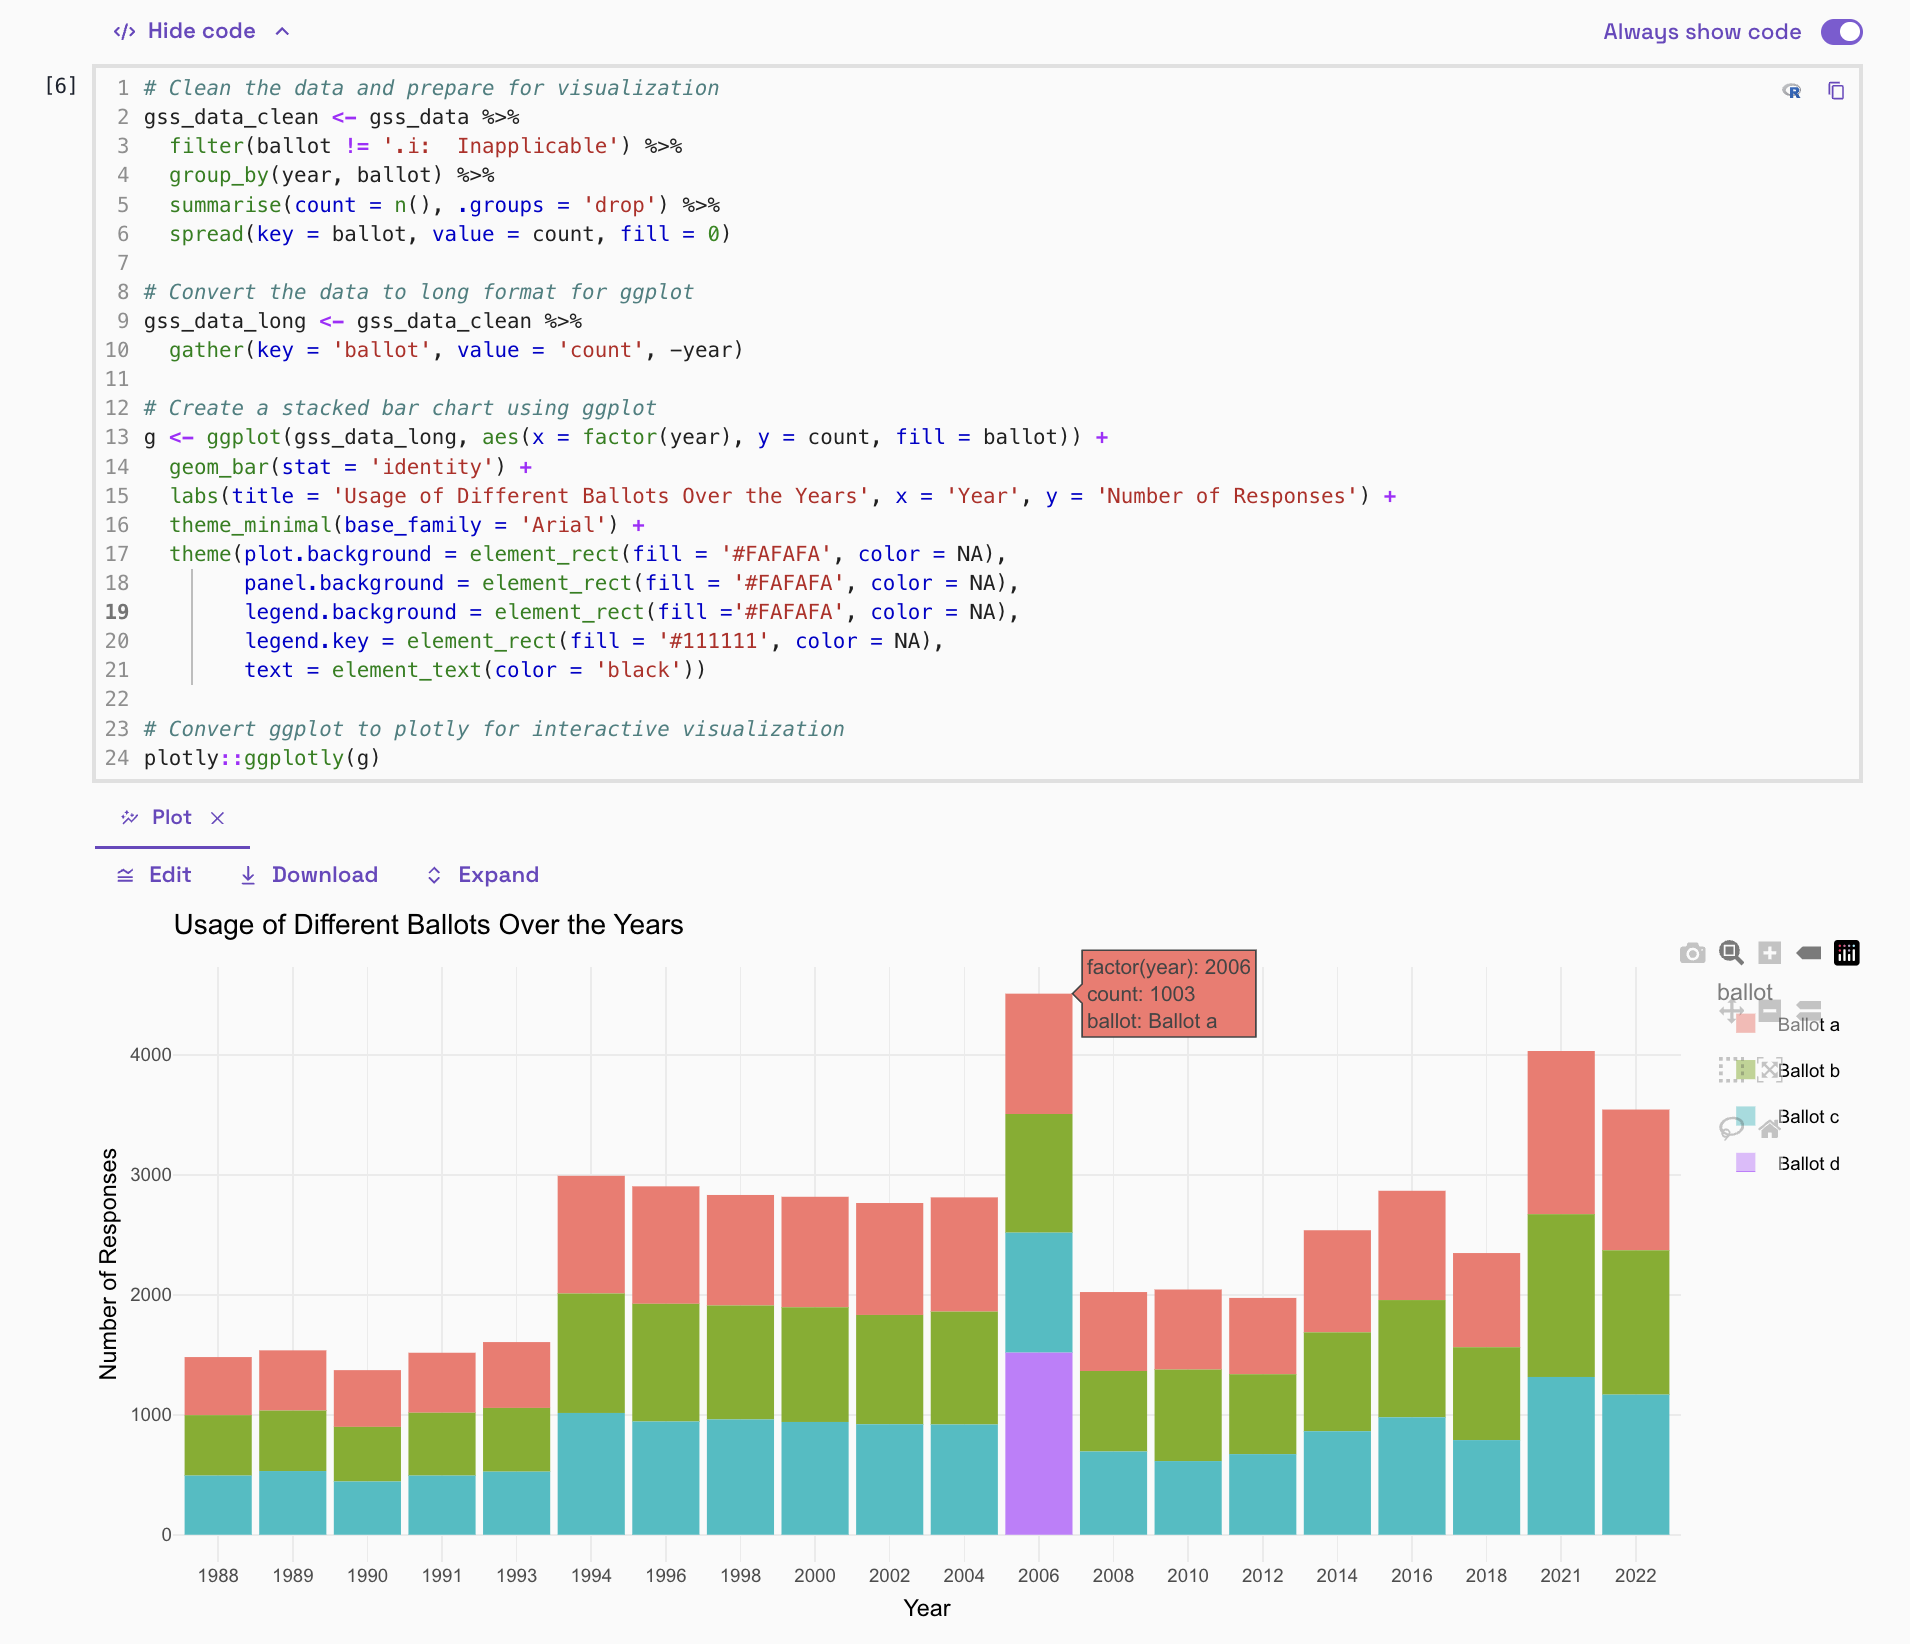
Visualize the usage of different ballots over the years.
Identifying Survey Trends
Another important analysis is identifying trends in the survey data, such as the distribution of survey responses over the years. This can help researchers understand how the survey's focus and respondent demographics may have shifted over time.
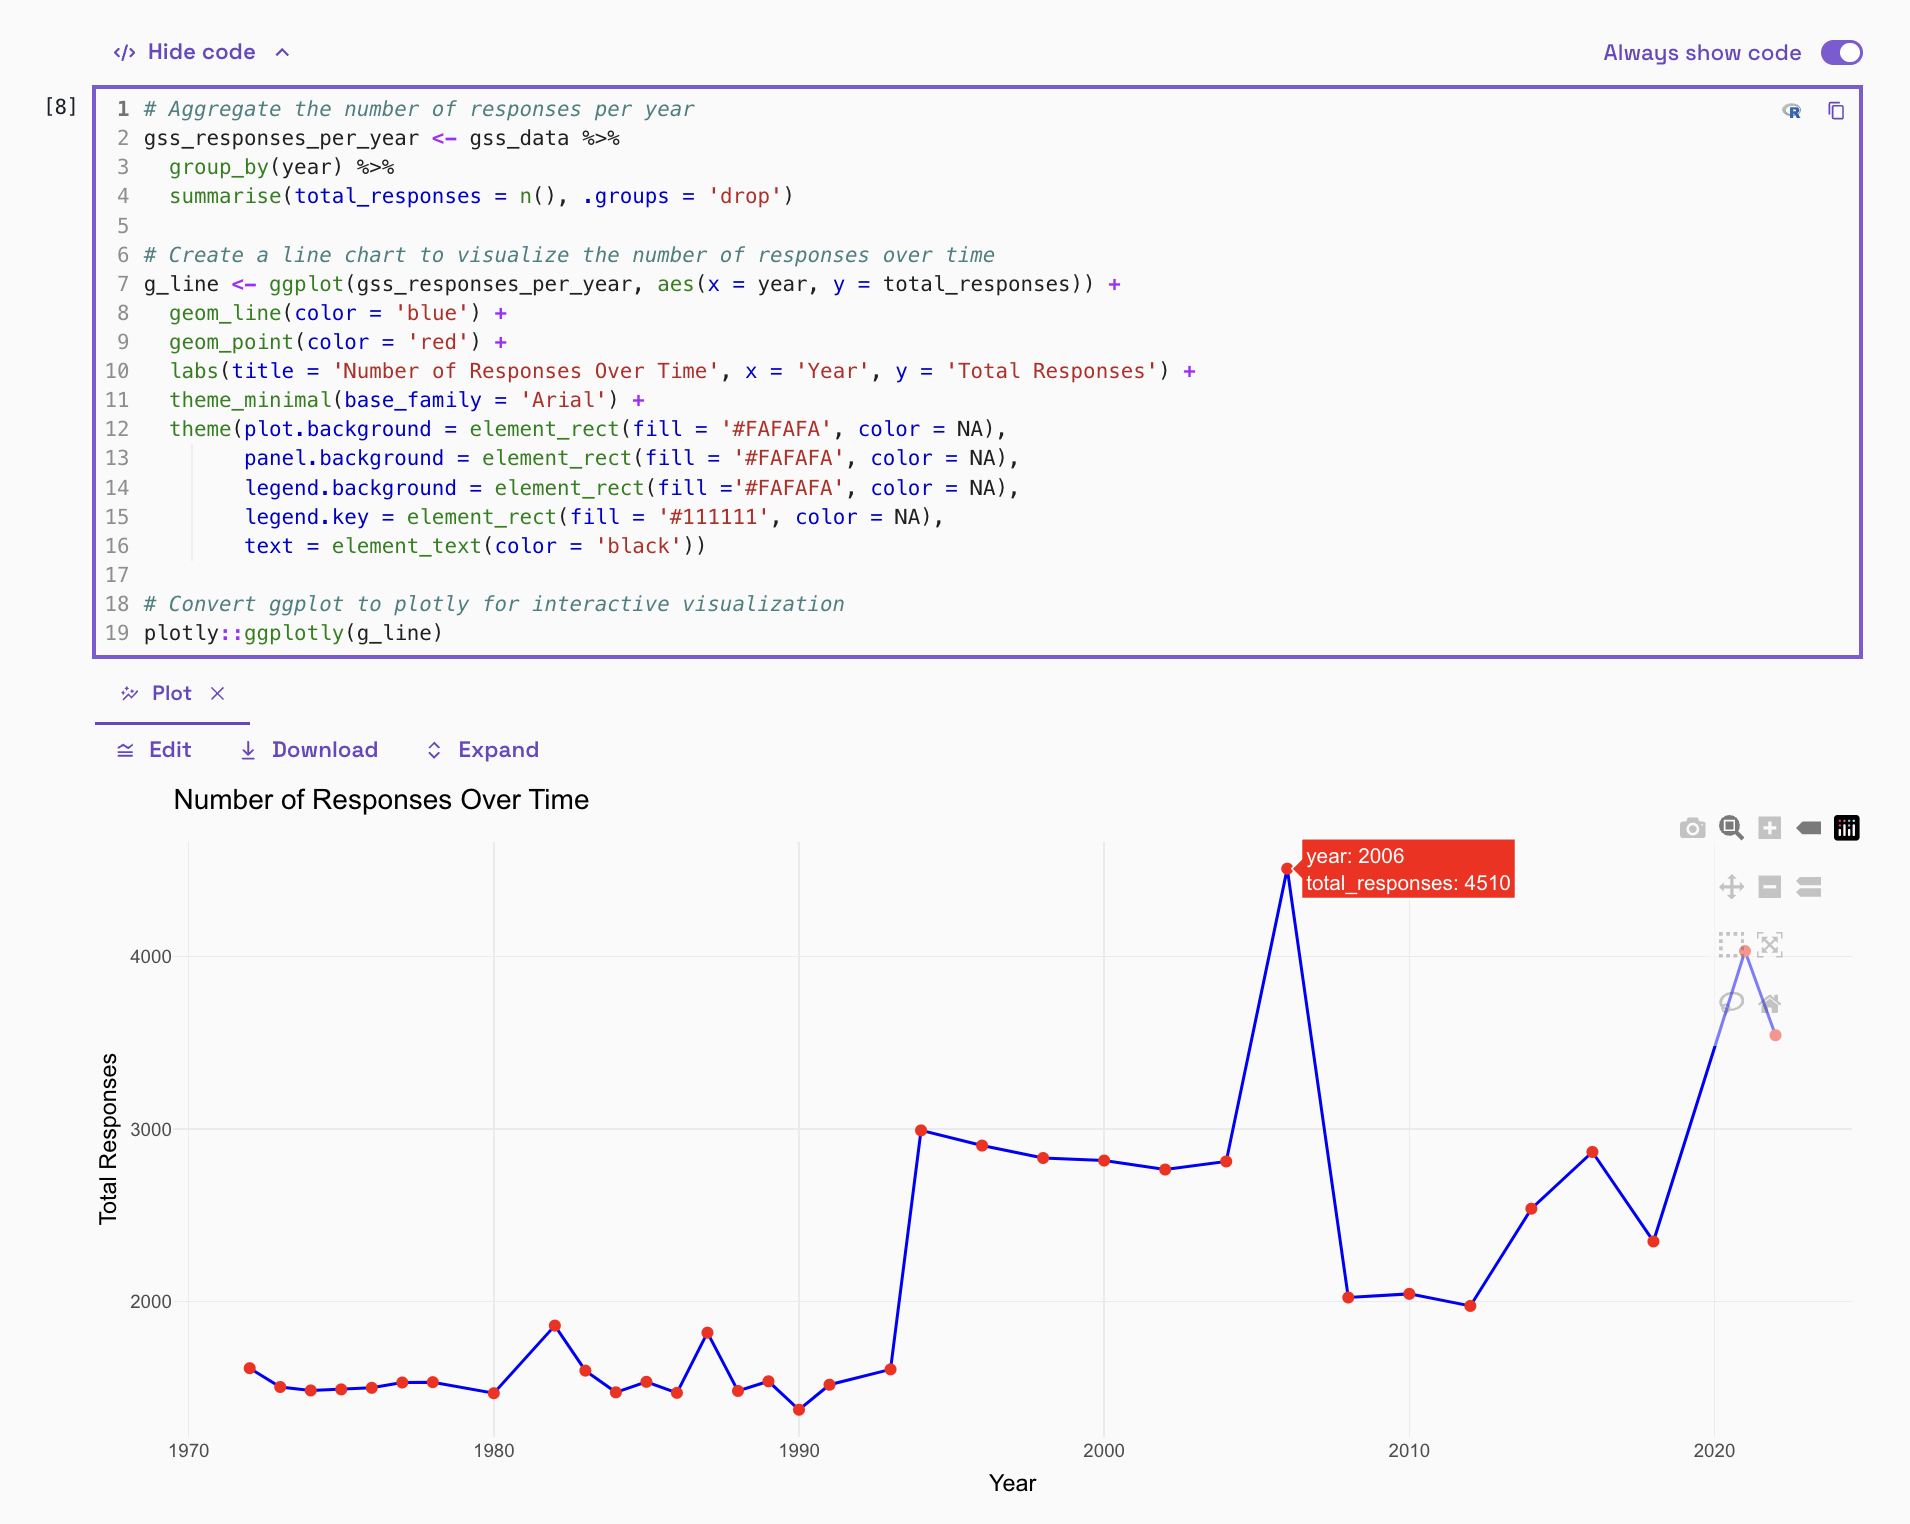
Identify trends in the survey data.
Using R for Advanced Statistical Analysis
Vizly allows you to perform advanced statistical analysis using R, without the hassle of setting up R Studio. This makes it easier to apply complex statistical models and techniques to your data. For example, running regression analysis or conducting hypothesis testing can help you draw deeper insights from the GSS data.
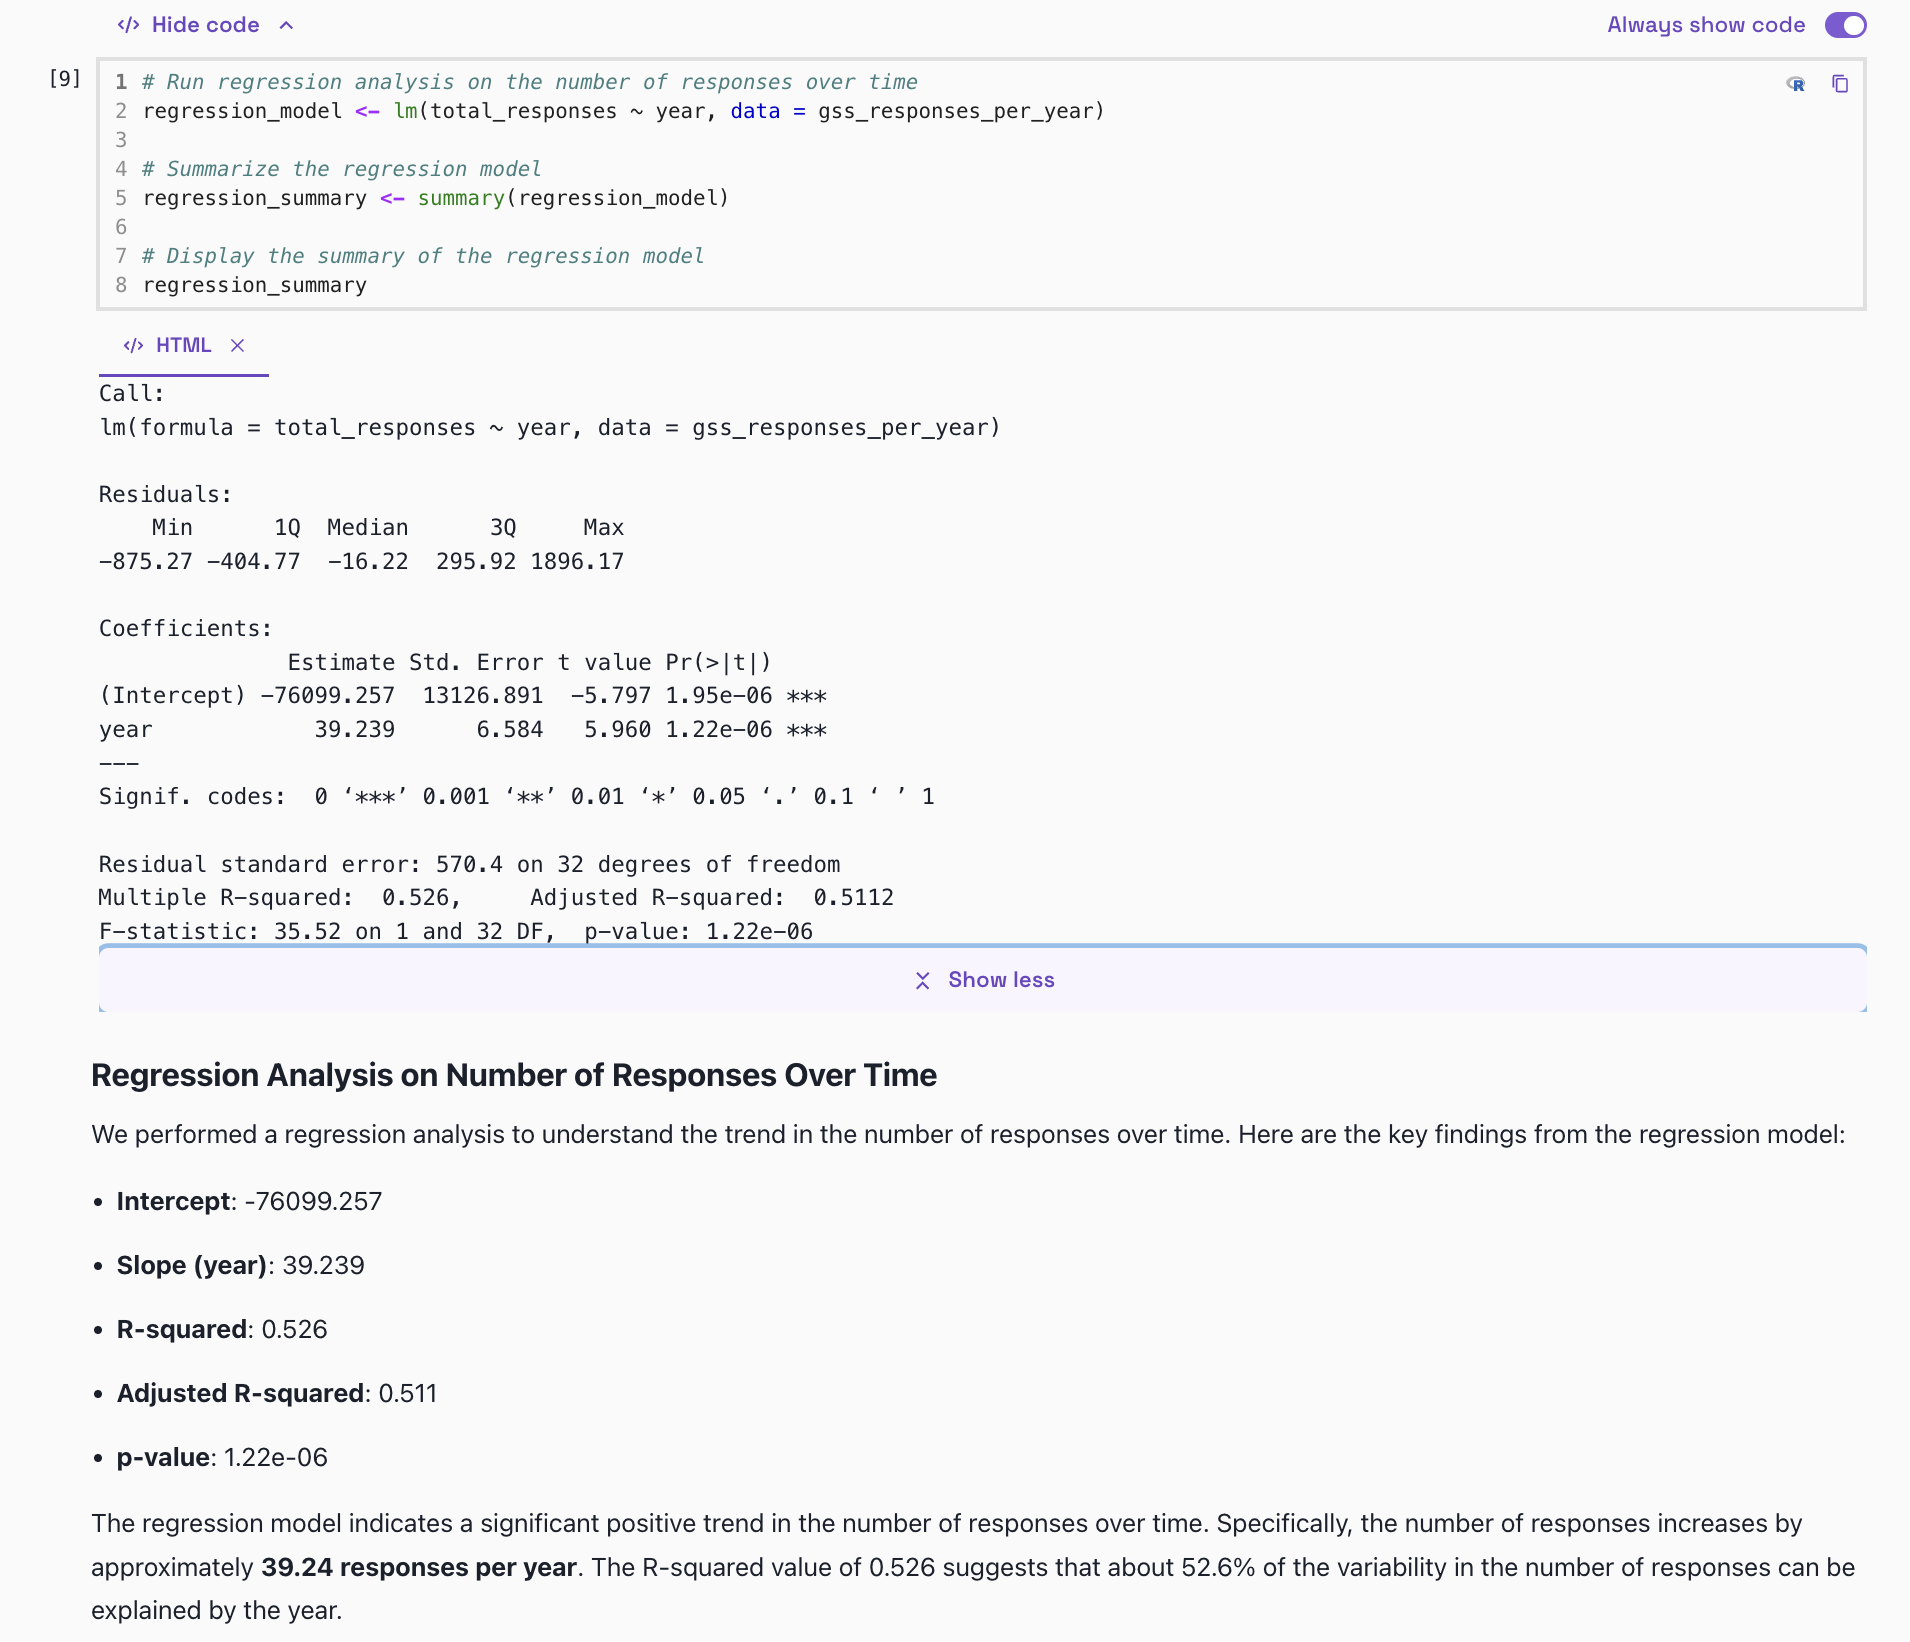
Run advanced statistical analyses using R within Vizly.
Conclusion
Vizly transforms the way sociologists interact with data by automating complex analyses and providing intuitive visualizations. This allows you to focus on deriving actionable insights and advancing your research without being bogged down by technical complexities.
Try Vizly now