Government Contracting Data Analysis with SamSearch & Vizly: A Step-by-Step Guide to Construction Spending Trends and Insights
Government contracting often involves navigating through complex sets of procurement data, vast spending reports, and a dynamic landscape of funding allocations. Interpreting this extensive information can be overwhelming. At SamSearch, we strive to simplify this process and empower businesses to make data-driven decisions. That’s why we’ve integrated with Vizly, a cutting-edge data analytics and visualization tool that breaks down real-time government spending data into clear, actionable insights.
In this blog post, we’ll guide you through a step-by-step walkthrough of how SamSearch utilizes Vizly to analyze construction spending trends within government contracting. Our example leverages a real dataset to show you how to:
- Identify key spending patterns and trends across various industries
- Understand average investments in specific categories
- Compare year-over-year changes and anticipate future government priorities
- Easily differentiate between public and private sector spending
By combining SamSearch’s powerful search and proposal resources with Vizly’s sophisticated data analysis features, you can gain a competitive edge in the government contracting arena and streamline your approach to securing valuable contracts.
Step 1: Loading the Dataset
To begin, we load a dataset into Vizly that contains detailed information on government contracting spending. These datasets often include multiple categories and sectors — spanning from Amusement and Recreation to Commercial and Communication. With Vizly’s intuitive interface, all you need to do is import your dataset and start exploring.
For our demonstration, we’re using a dataset focusing on government spending in construction. This includes spending trends in Amusement and Recreation, Commercial, and Communication projects. Vizly lets you seamlessly load this data and jump straight into analysis.
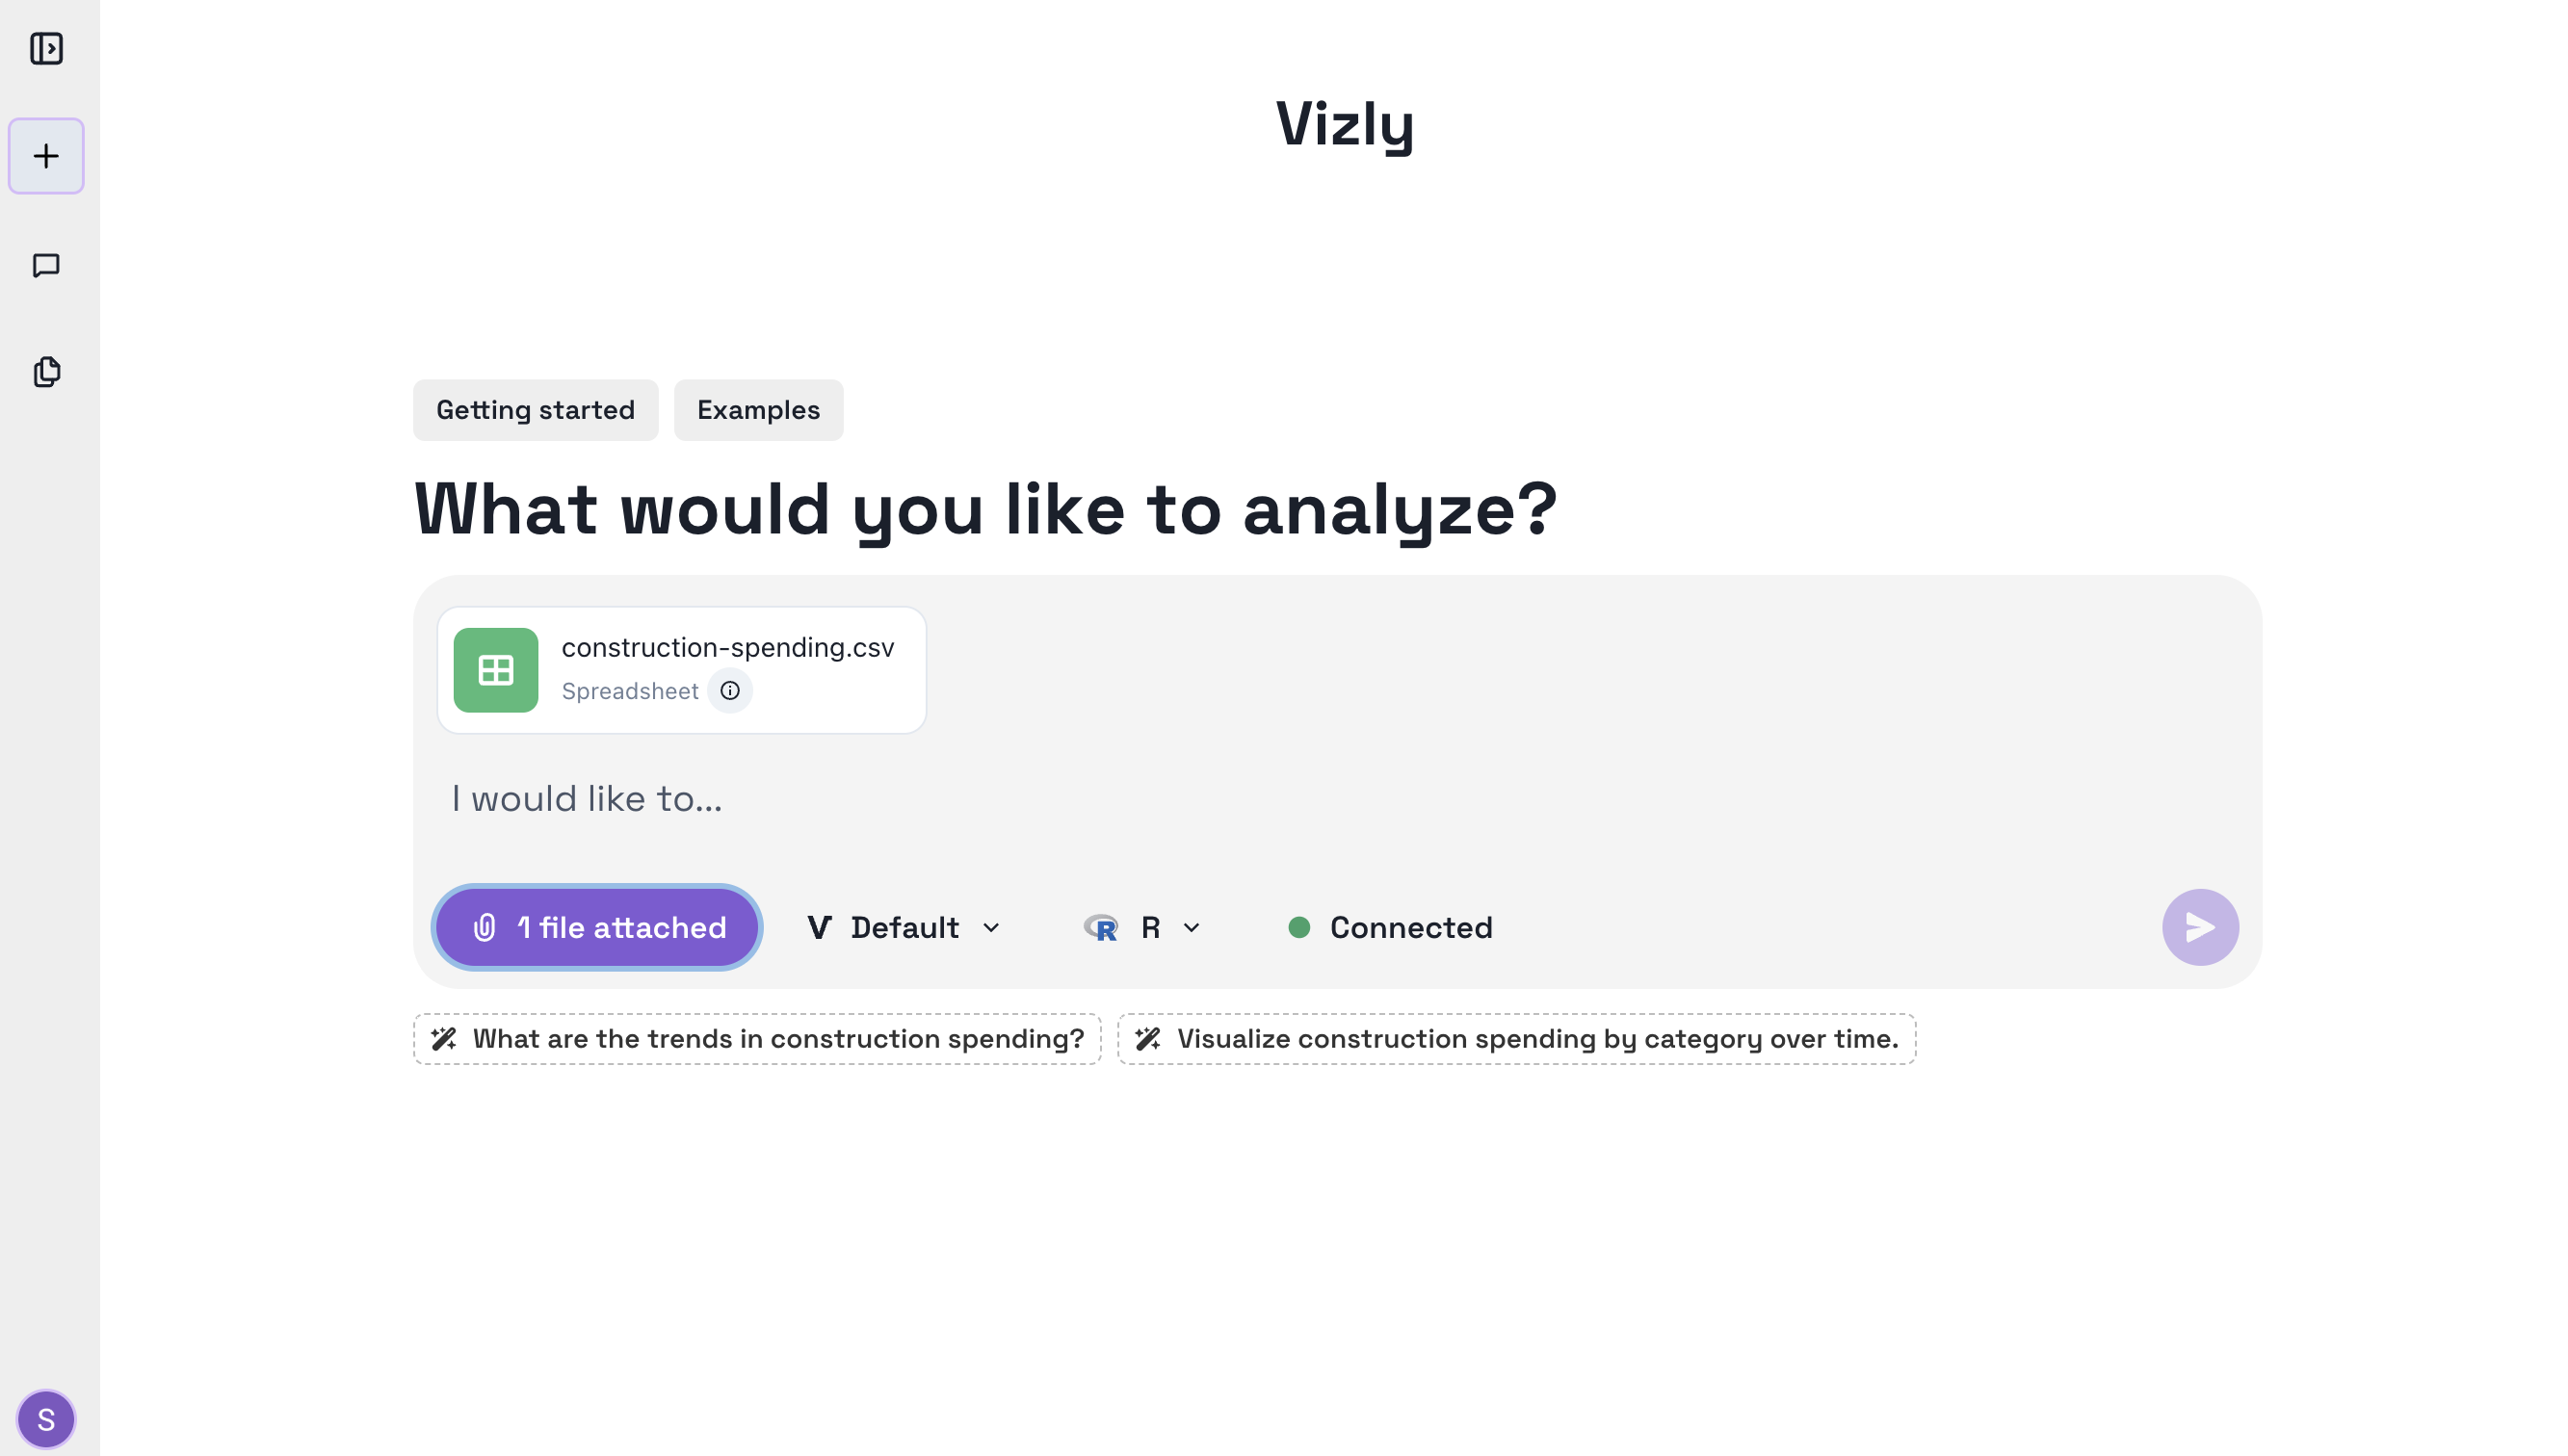
Loading the construction spending dataset into Vizly
Step 2: Analyzing Trends in Construction Spending
With the dataset loaded, we can ask meaningful questions: How has construction spending changed over time? Are certain sectors more volatile than others? Vizly’s natural language search and data visualization capabilities let you rapidly explore trends with just a few clicks.
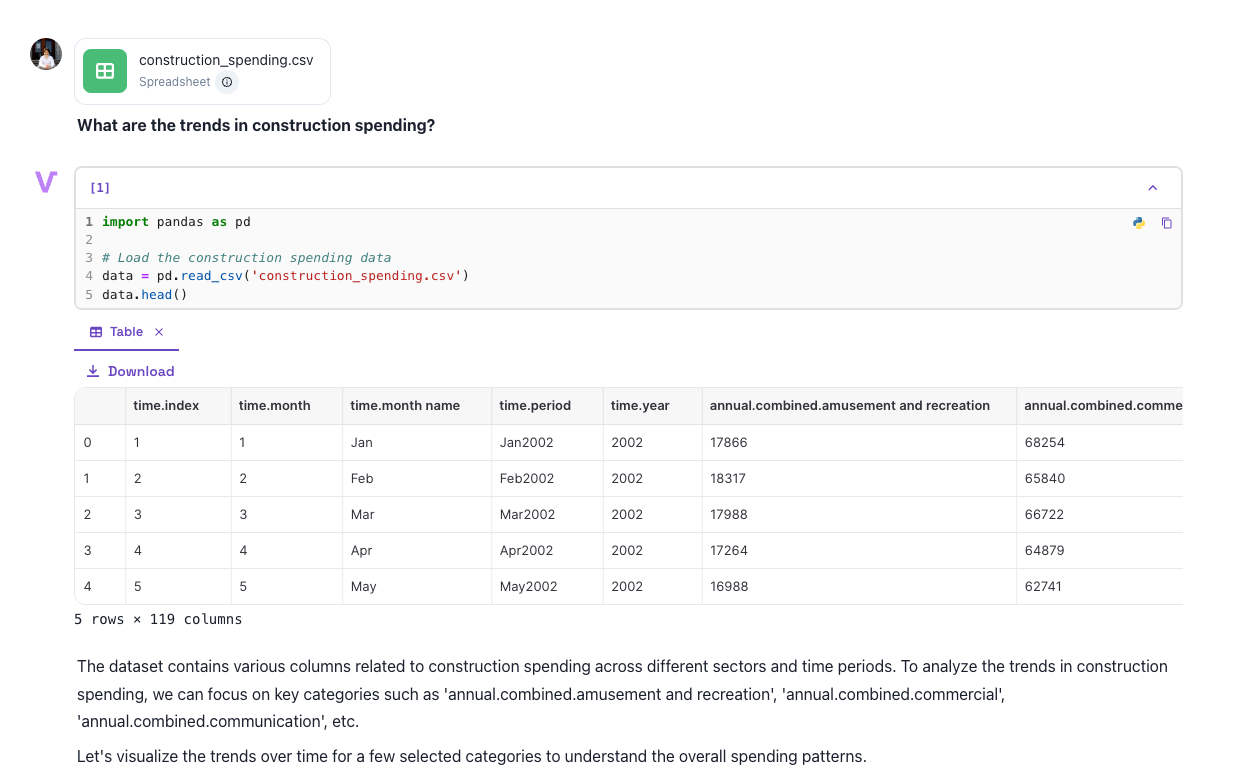
Table showing construction spending trends
By breaking down spending into categories, Vizly enables you to understand how allocations have changed. For example:
- Amusement and Recreation: Spending here may spike with seasonal or event-driven projects, reflecting changing government priorities.
- Commercial: This category often exhibits more stable spending patterns, indicating a consistent flow of investment year after year.
- Communication: Spending may show peaks and troughs tied to infrastructure upgrades, new policy-driven initiatives, or shifts in technology.
Below is a chart visualizing these trends:
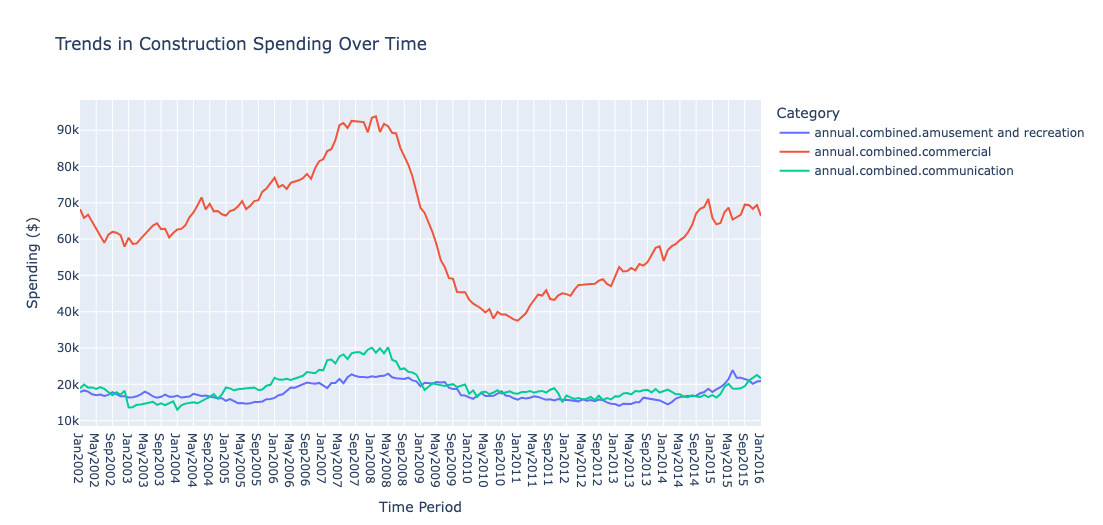
Chart showing construction spending trends
Step 3: Understanding Average Spending in Each Category
Next, we explore the average spending across these sectors. Vizly can quickly calculate averages to highlight which categories attract the most substantial, long-term investment. This snapshot helps contractors understand where the consistent “big money” tends to be spent, guiding them in focusing their efforts where the opportunity is greatest.
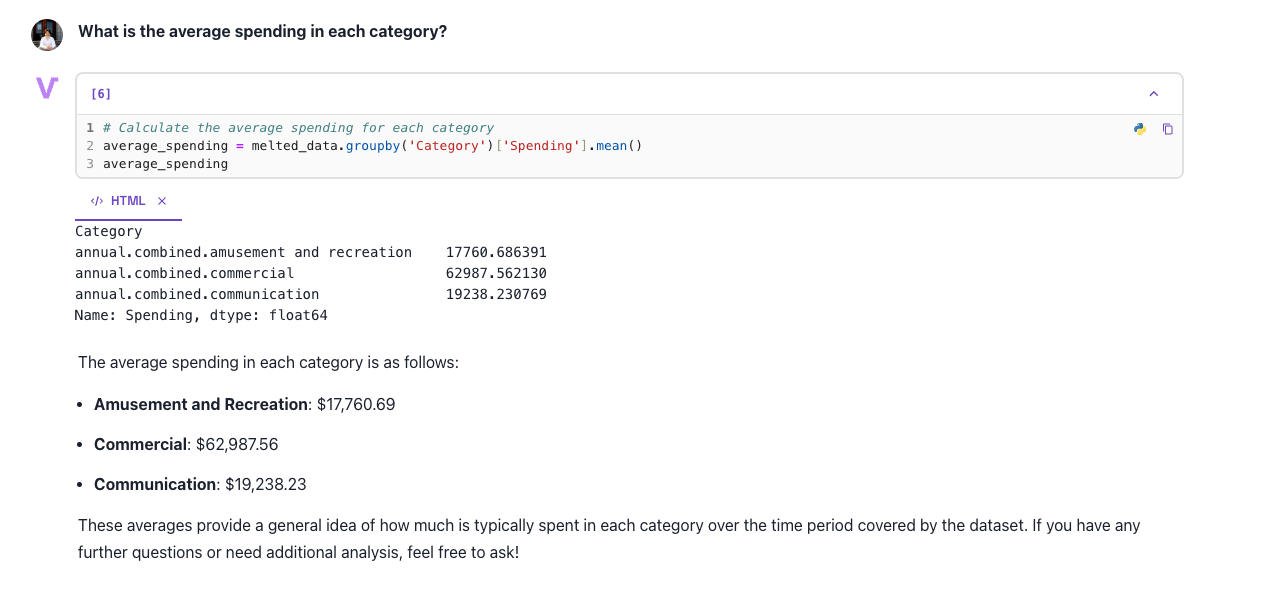
Chart showing average spending in each category
With this visualization, you can immediately identify which sectors are top priorities for government investment.
Step 4: Year-Over-Year Comparison
Government policies evolve, and funding allocations shift with changing priorities. By comparing year-over-year spending, Vizly highlights these shifts. Asking, “How does spending compare year over year?” can help you spot trends, investment cycles, and areas of growth or decline.
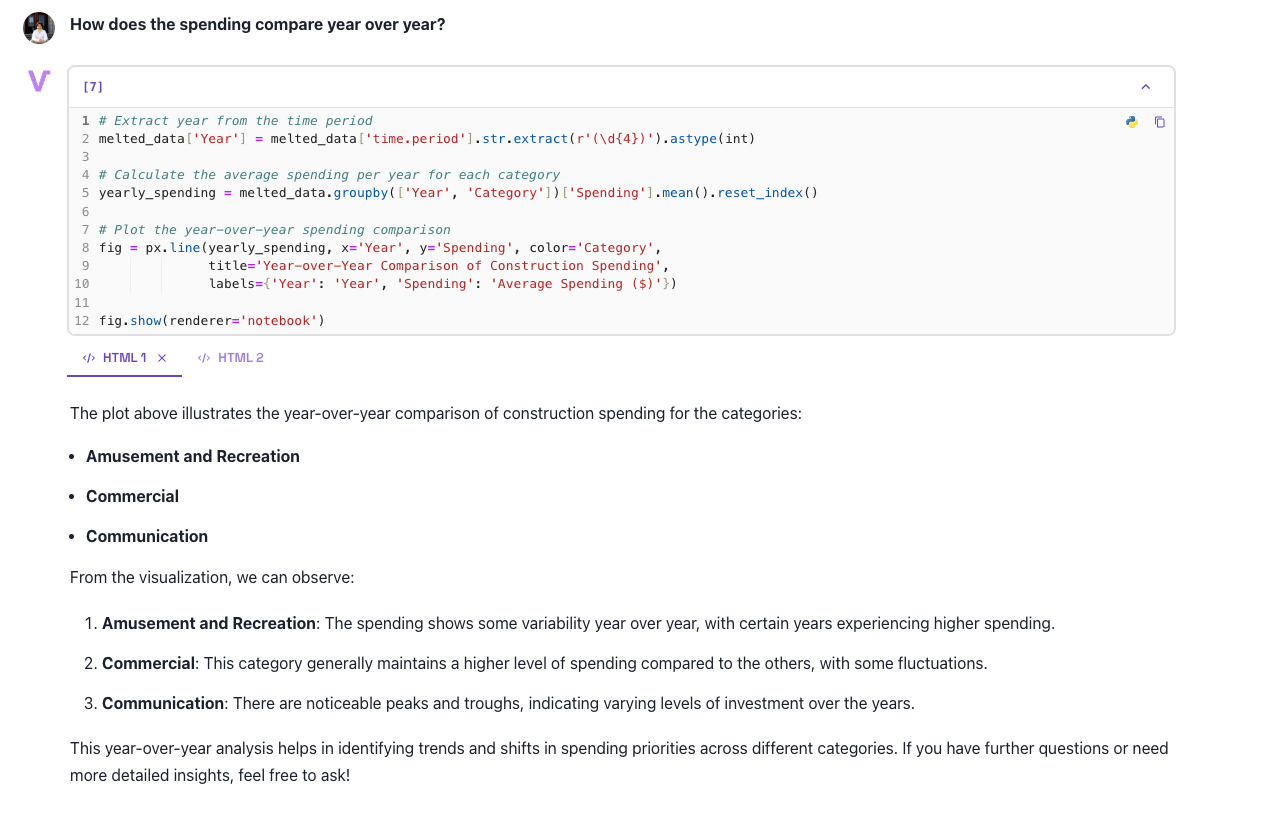
Analysis showing year-over-year comparison
For example, certain categories like Amusement and Recreation might experience significant annual changes due to new policies or projects, while Commercial investments remain steady. Understanding these patterns allows contractors to anticipate future investment streams.
Vizly’s year-over-year comparison charts make it simple to visualize these fluctuations at a glance:
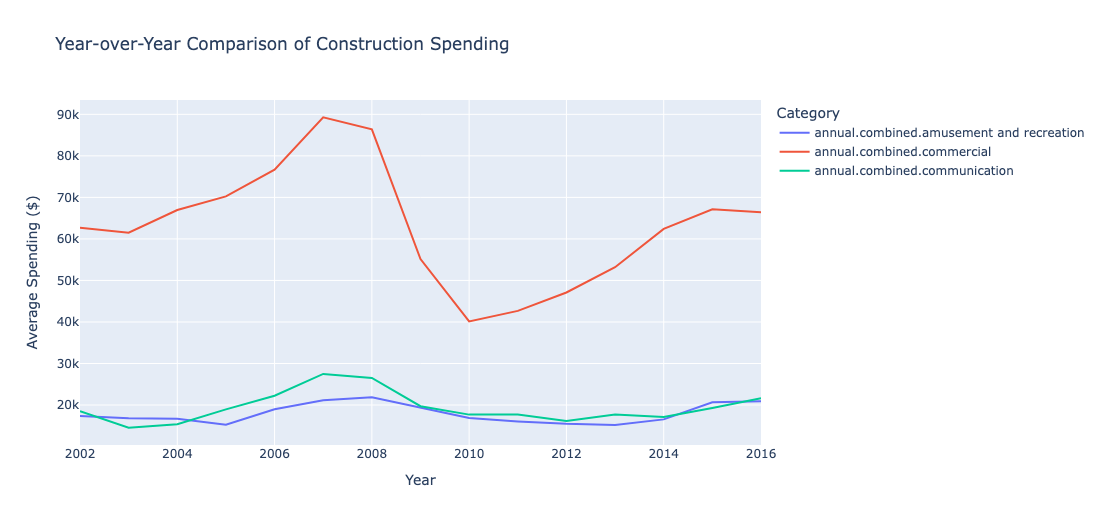
Year-over-year breakdown of spending by category
Step 5: Comparing Public vs. Private Spending
Another critical aspect of government contracting involves comparing the public sector’s spending patterns to those in the private sector. This comparison helps contractors understand the broader ecosystem of funding and identify which opportunities may emerge from public infrastructure projects.
For instance, in Sewage and Waste Management, public funding may vary dramatically based on infrastructure bills or environmental initiatives, while private spending remains relatively constant. Vizly’s visualizations allow for a clear, side-by-side comparison of these variations.

Comparison of public vs. private sector spending
Step 6: Specialized Analysis - Transportation Spending
Transportation is a vital category in government spending. By zeroing in on transportation spending, you can understand how it stacks up against other sectors. Vizly makes it easy to isolate a single category—like Transportation—and compare its trends, average investments, and year-over-year changes against the broader dataset.
The data may show that transportation receives robust, yet occasionally fluctuating, funding tied to large-scale projects such as highways, bridges, or transit systems. These insights help contractors strategically position themselves to win these high-value contracts.
Below is a visualization comparing transportation spending to other categories:
Comparison of transportation spending with other categories
Step 7: Generating Reports and Key Insights
After diving deep into trends, averages, and comparative analyses, Vizly allows you to generate comprehensive reports that package all these insights together. SamSearch then takes these reports and integrates them into our platform, so you can easily access, share, and act upon the insights.
From identifying high-potential sectors to spotting emerging trends, these reports help contractors focus their efforts where it matters most, ensuring they’re always ahead of the curve and ready to meet future government contracting opportunities.
Why use Vizly if you’re in government contracting?
Effective data analysis is the key to standing out in a competitive government contracting environment. With SamSearch and Vizly, you gain the power to:
- Identify spending trends across multiple industries
- Assess average investment levels to target the most lucrative sectors
- Track evolving government priorities through year-over-year comparisons
- Differentiate between public and private sector spending
- Create detailed reports that guide your proposal strategies
With SamSearch's robust search capabilities and Vizly's visual analytics, you have all the tools you need to stay informed and succeed in the government contracting landscape.
Next Steps: Dive Deeper with Vizly
The steps we’ve covered are just the tip of the iceberg. Vizly’s comprehensive analytical toolkit lets you explore even deeper, asking questions like:
- How does government spending differ by region or geographic area?
- Which sectors show the most growth potential over several years?
- How do emerging technologies or policy shifts influence spending patterns?
The answers to these questions can uncover unparalleled opportunities for contractors looking to position themselves in the right markets at the right times.
Explore Vizly's Features
Vizly is more than just a data visualization platform; it's an intelligence engine designed to simplify complex data analysis. With Vizly, you can:
- Natural Language Queries: Ask questions in plain English and get instant visual insights without requiring advanced technical skills.
- Interactive Visualizations: Create customized, interactive visualizations that let you drill down into specific categories, timeframes, or regions.
- Shareable Reports: Generate shareable reports that keep you and your team informed on the latest trends and opportunities.
Vizly provides a user-friendly environment that bridges the gap between raw data and actionable insights, making it an essential tool for contractors, analysts, and decision-makers working within the government sector.
Explore SamSearch's Features
SamSearch complements Vizly by streamlining the process of finding and qualifying government contracting opportunities.
- Advanced Search: Quickly locate government contracts that match your expertise, industry, and geographic focus.
- Proactive Alerts: Stay ahead of the competition by receiving notifications about new and relevant opportunities as soon as they’re posted.
- Proposal Guidance: Access resources and guidance to create compelling proposals that align with government priorities, backed by data-driven insights from Vizly.
Together, SamSearch and Vizly form a powerful ecosystem that simplifies your approach to government contracting—helping you make informed decisions, craft more competitive bids, and ultimately win the contracts that propel your business forward.